
Groth investors are looking for stocks showing high revenue and EPS growth. We will have a look here to see if WORKDAY INC-CLASS A (NASDAQ:WDAY) is suited for growth investing, while it is forming a base and may be ready to breakout. Investors should of course do their own research, but we spotted WORKDAY INC-CLASS A showing up in our growth with base formation screen, so it may be worth spending some more time on it.
Deciphering NASDAQ:WDAY's Growth Rating
ChartMill assigns a Growth Rating to each stock, ranging from 0 to 10. This rating is determined by analyzing different growth elements, including EPS and revenue growth, spanning both historical and future figures. In the case of NASDAQ:WDAY, the assigned 8 reflects its growth potential:
- The Earnings Per Share has grown by an impressive 32.13% over the past year.
- The Earnings Per Share has been growing by 33.84% on average over the past years. This is a very strong growth
- The Revenue has grown by 16.81% in the past year. This is quite good.
- WDAY shows a strong growth in Revenue. Measured over the last years, the Revenue has been growing by 20.80% yearly.
- Based on estimates for the next years, WDAY will show a quite strong growth in Earnings Per Share. The EPS will grow by 16.57% on average per year.
- Based on estimates for the next years, WDAY will show a quite strong growth in Revenue. The Revenue will grow by 14.41% on average per year.
Health Assessment of NASDAQ:WDAY
A critical element of ChartMill's stock evaluation is the Health Rating, which spans from 0 to 10. This rating considers multiple health factors, including liquidity and solvency, both in absolute terms and relative to industry peers. NASDAQ:WDAY has received a 7 out of 10:
- An Altman-Z score of 5.94 indicates that WDAY is not in any danger for bankruptcy at the moment.
- Looking at the Altman-Z score, with a value of 5.94, WDAY is in the better half of the industry, outperforming 68.82% of the companies in the same industry.
- The Debt to FCF ratio of WDAY is 1.41, which is an excellent value as it means it would take WDAY, only 1.41 years of fcf income to pay off all of its debts.
- WDAY has a better Debt to FCF ratio (1.41) than 69.18% of its industry peers.
- A Debt/Equity ratio of 0.35 indicates that WDAY is not too dependend on debt financing.
- Even though the debt/equity ratio score it not favorable for WDAY, it has very limited outstanding debt, so we won't put too much weight on the DE evaluation.
- WDAY has a Current Ratio of 2.05. This indicates that WDAY is financially healthy and has no problem in meeting its short term obligations.
- WDAY has a better Current ratio (2.05) than 60.93% of its industry peers.
- WDAY has a Quick Ratio of 2.05. This indicates that WDAY is financially healthy and has no problem in meeting its short term obligations.
- WDAY has a better Quick ratio (2.05) than 62.01% of its industry peers.
Exploring NASDAQ:WDAY's Profitability
ChartMill employs its own Profitability Rating system for stock evaluation. This score, ranging from 0 to 10, is derived from an analysis of diverse profitability metrics and margins. In the case of NASDAQ:WDAY, the assigned 6 is noteworthy for profitability:
- WDAY's Return On Assets of 9.87% is amongst the best of the industry. WDAY outperforms 86.02% of its industry peers.
- With an excellent Return On Equity value of 18.79%, WDAY belongs to the best of the industry, outperforming 86.38% of the companies in the same industry.
- With a decent Return On Invested Capital value of 2.76%, WDAY is doing good in the industry, outperforming 69.89% of the companies in the same industry.
- WDAY has a Profit Margin of 19.87%. This is amongst the best in the industry. WDAY outperforms 86.74% of its industry peers.
- Looking at the Operating Margin, with a value of 5.13%, WDAY is in the better half of the industry, outperforming 71.68% of the companies in the same industry.
- WDAY has a Gross Margin of 75.60%. This is in the better half of the industry: WDAY outperforms 68.82% of its industry peers.
How do we evaluate the setup for NASDAQ:WDAY?
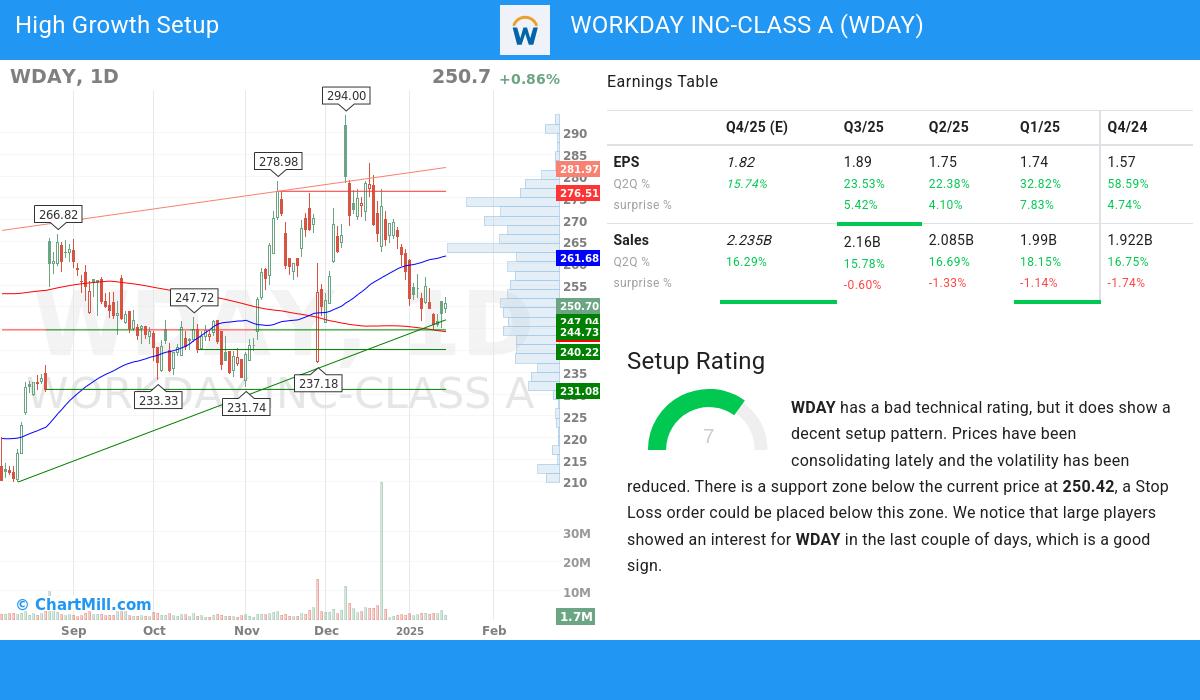
ChartMill incorporates a Setup Rating in its analysis, which measures the extent of consolidation in a stock over recent days and weeks. This rating, ranging from 0 to 10, is updated daily and takes into account multiple short-term technical indicators. The current setup rating for NASDAQ:WDAY is 7:
Although the technical rating is bad, WDAY does present a nice setup opportunity. Prices have been consolidating lately and the volatility has been reduced. There is a support zone below the current price at 250.42, a Stop Loss order could be placed below this zone. We notice that large players showed an interest for WDAY in the last couple of days, which is a good sign.
Our Strong Growth screener lists more Strong Growth stocks and is updated daily.
For an up to date full fundamental analysis you can check the fundamental report of WDAY
For an up to date full technical analysis you can check the technical report of WDAY
Keep in mind
This article should in no way be interpreted as advice. The article is based on the observed metrics at the time of writing, but you should always make your own analysis and trade or invest at your own responsibility.