Market Monitor Trends (SPY, QQQ, IWM) and Breadth May 14
By Kristoff De Turck - reviewed by Aldwin Keppens
Last update: May 14, 2025

(All data & visualisations by ChartMill.com)
Daily Market Trend Analysis – May 13, 2025 (After Market Close)
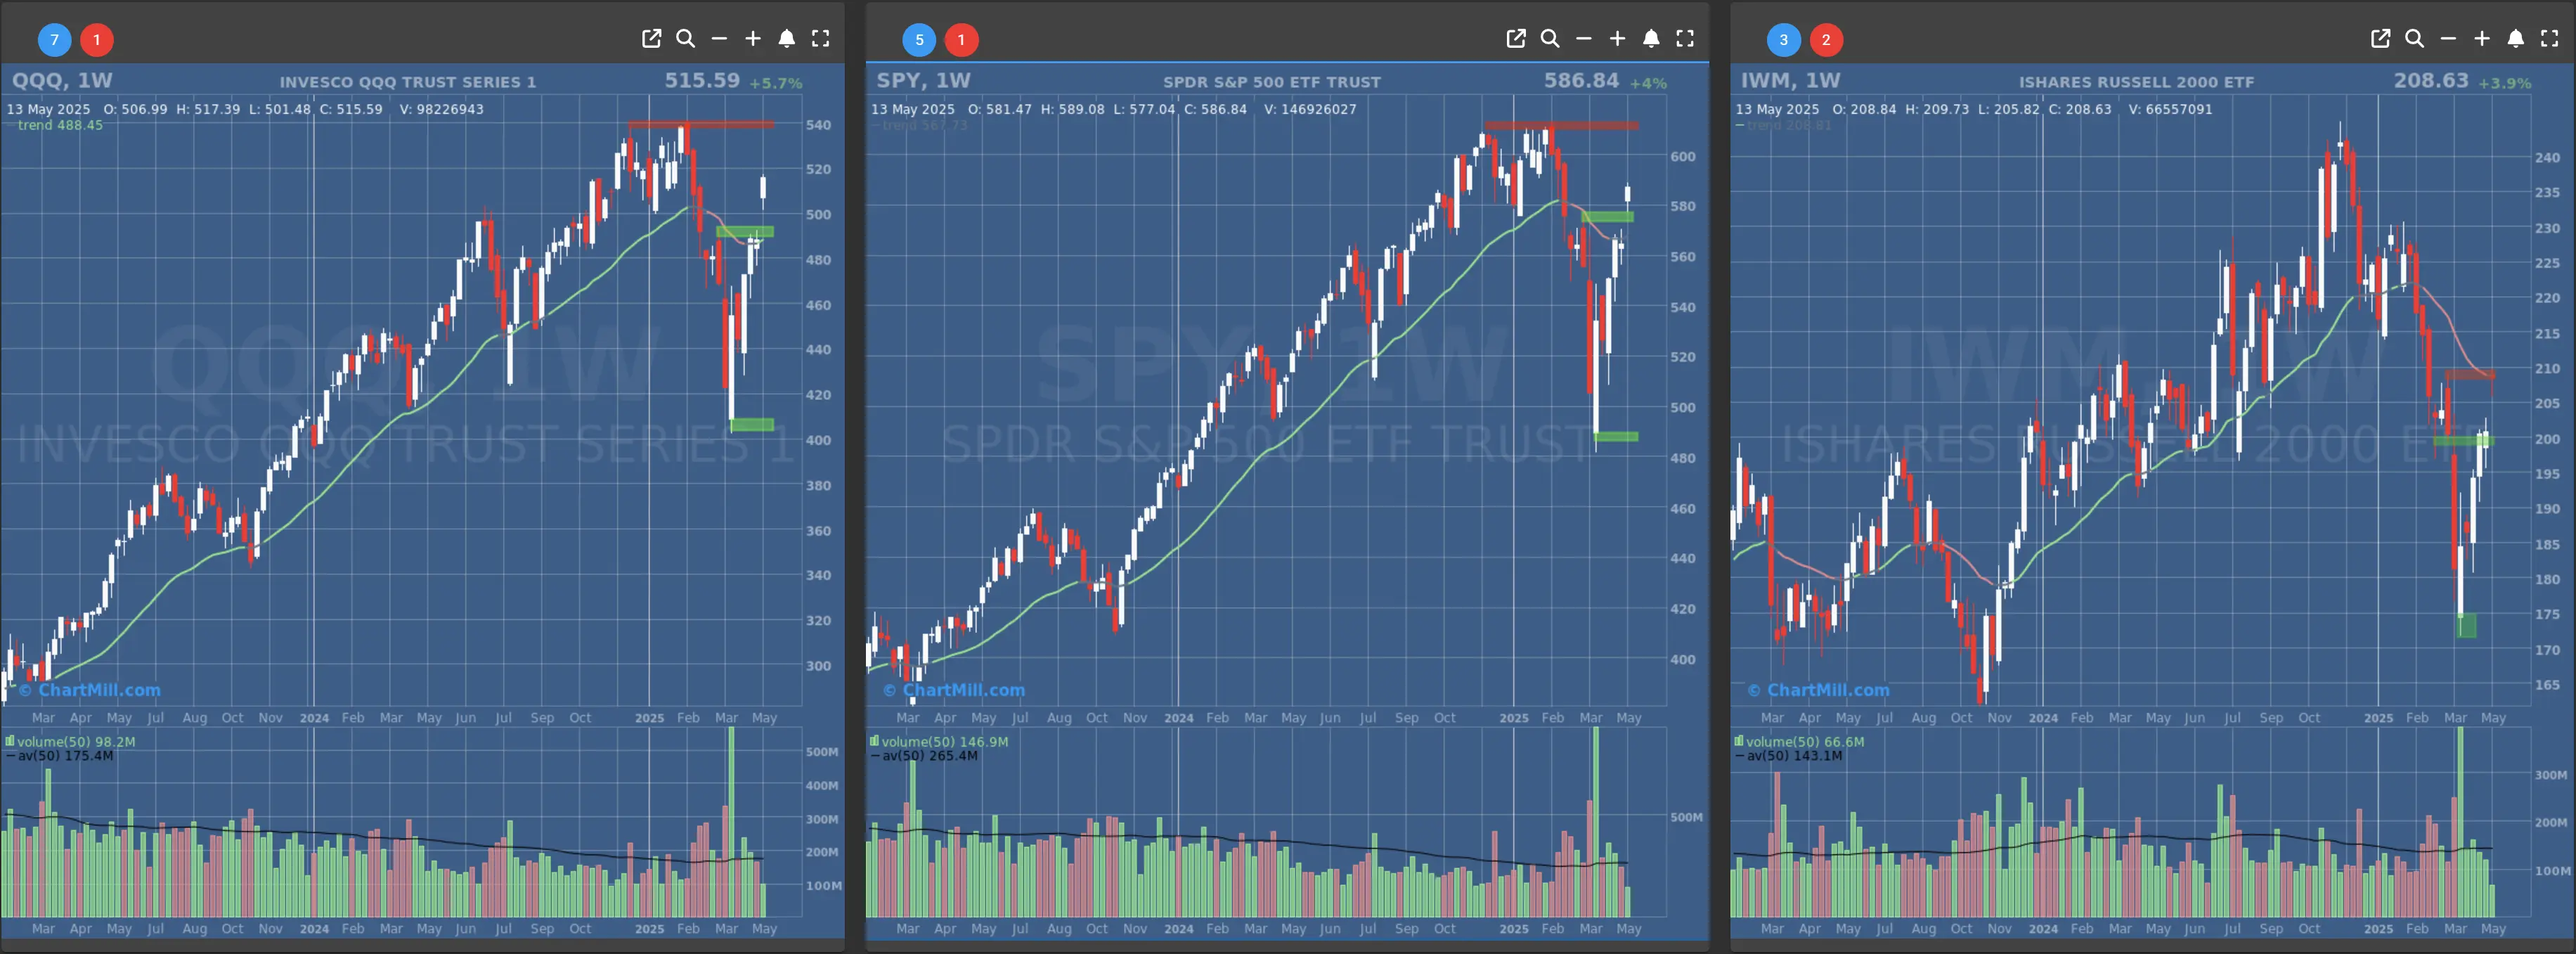
The major U.S. indices continue to hold their bullish short-term trends following a strong rebound from April lows.
Both the S&P 500 (SPY) and Nasdaq-100 (QQQ) are showing healthy follow-through action, with prices moving firmly above key support levels and approaching resistance zones.
Meanwhile, the Russell 2000 (IWM) is lagging slightly in terms of volume and strength but still maintaining its upward trajectory.
Short Term Trend

- Short-Term Trend: Bullish (no change)
- Support at $560 - $570
- Resistance at $610
- Volume: At average (50)
- Pattern: Follow-through day
- Short-Term Trend: Bullish (no change)
- Support at $490 - $500
- Resistance at $540
- Volume: At average (50)
- Pattern: Follow-through day
- Short-Term Trend: Bullish (no change)
- Support at $200
- Resistance at $210-215
- Volume: Below average (50)
- Pattern: Inside Day
Long Term Trend
- Long-Term Trend: Neutral (no change)
- Long-Term Trend: Positive (from Neutral)
- Long-Term Trend: Neutral (no change)
Daily Market Breadth Analysis – May 13, 2025 (After Market Close)
Over the past several trading sessions, market breadth has shown a clear and encouraging shift toward strength, particularly in the short to medium term.
After a shaky start to May, with May 5 and 6 reflecting notably weak participation from advancing stocks, the last several days have seen a decisive improvement in breadth metrics.
On May 13, 2025, around 62% of stocks closed higher, continuing a streak of positive breadth days. This follows a particularly strong showing on May 12, when more than 75% of stocks advanced.
Even more telling is the number of stocks gaining more than 4% on those days, which suggests not just passive participation, but strong momentum among individual names.
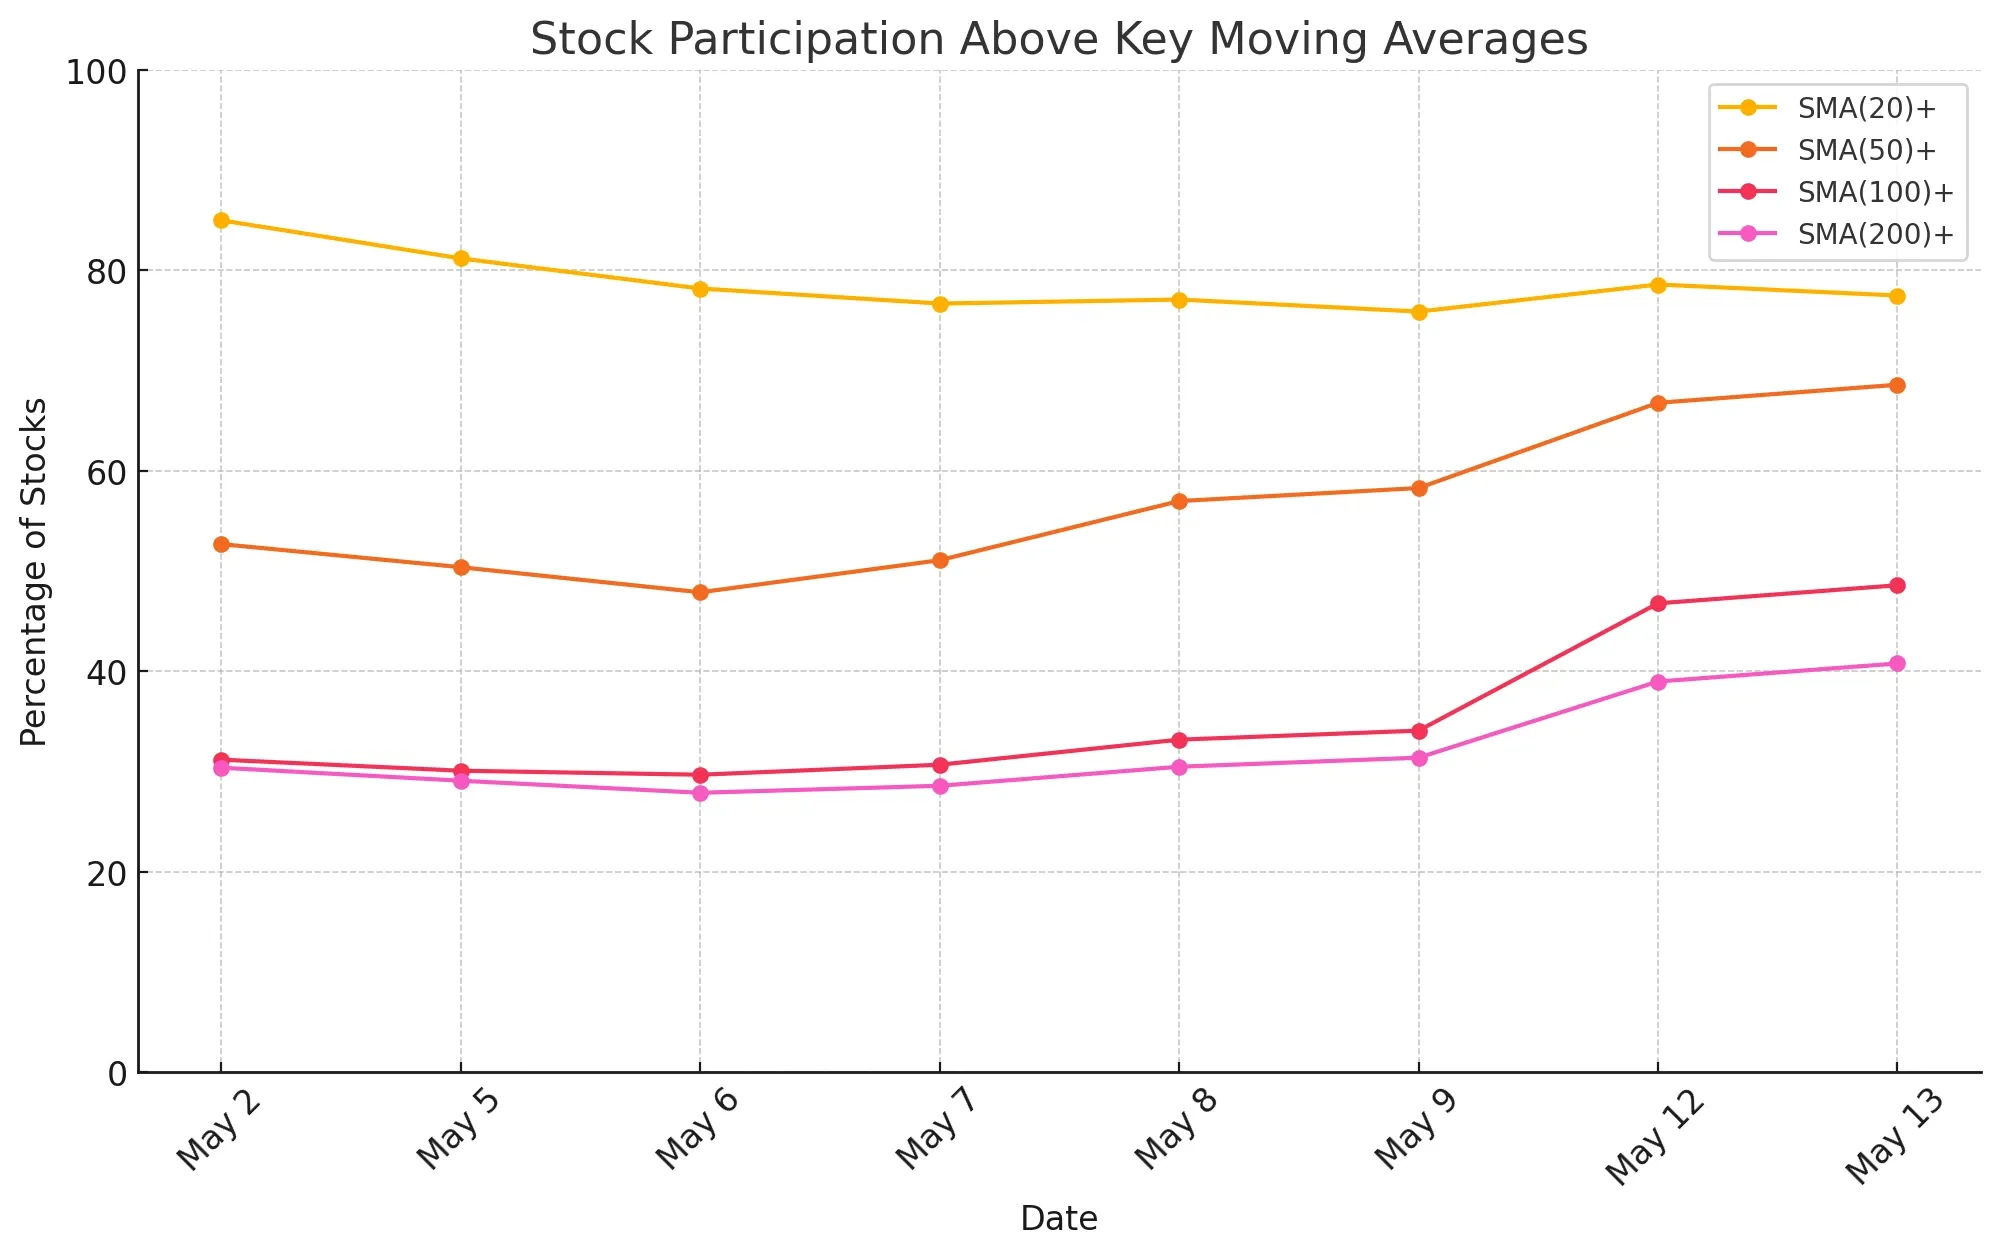
Key Moving Averages
Participation above key moving averages also supports this improving picture. As of the most recent data, over 77% of stocks are trading above their 20-day simple moving average, and nearly 69% are above the 50-day. These are typically signs that short- to intermediate-term trends are turning bullish.
-
Intermediate-term recovery (SMA 100) is gaining traction, especially over the last two sessions.
-
Long-term participation (SMA 200), while still the weakest, has started to pick up—an encouraging sign if the trend continues.
This upward momentum in moving average participation indicates broader market recovery, especially if the SMA(100)+ and SMA(200)+ curves continue to rise. It's a signal that more stocks are reclaiming both short- and long-term technical ground.
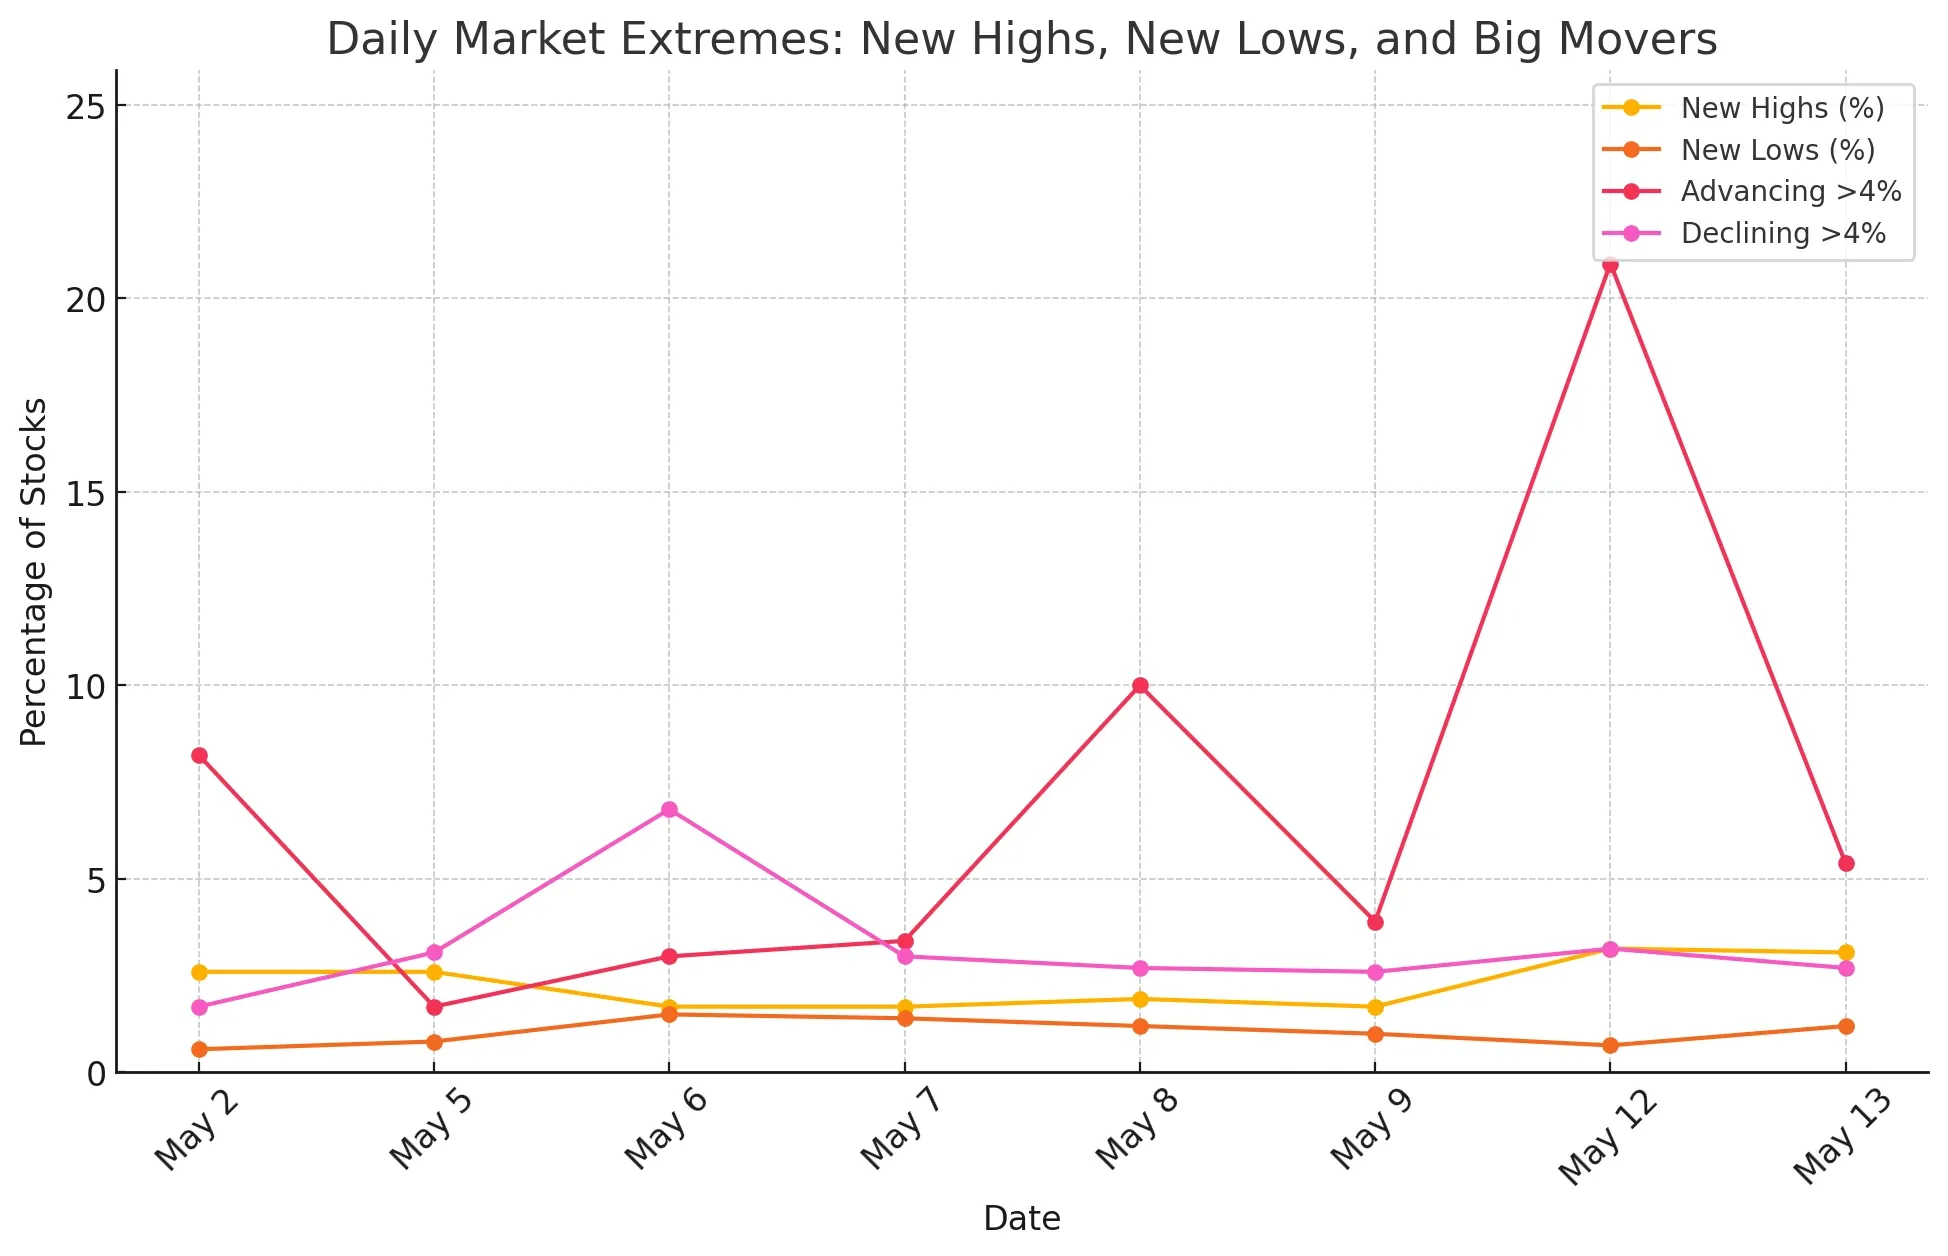
New Highs, New Lows
The ratio of new highs to new lows is also gradually improving. While the number of new highs remains modest overall, it's steadily outpacing new lows, a sign that more stocks are starting to push into fresh breakout territory.
-
New highs have slowly increased since early May, peaking slightly on May 12. However, the numbers are still relatively low, suggesting breakouts remain limited.
-
New lows have stayed consistently low, which is a positive sign — downside extremes are becoming less common.
-
Big gainers (>4%) surged on May 12, with over 20% of stocks making strong upward moves, highlighting a burst of bullish momentum.
-
Big decliners (>4%), on the other hand, peaked earlier on May 6 but have since moderated, reinforcing the market’s improving tone.
Looking at longer-term breadth metrics adds important context. The percentage of advancing stocks over the past month has risen above 80%, indicating strong recent recovery. However, when we zoom out to the 3-month timeframe, the story shifts. Nearly 70% of stocks are still in the red over that period, and only a small fraction—around 3–4%—have posted gains greater than 25%.
This suggests that while recent strength is real, it’s mostly a rebound within a broader corrective or sideways phase.
In summary, the market is clearly improving under the surface. Short-term breadth is strong, momentum is picking up, and participation is broadening.
But for a true bull trend to take hold, we'll need to see continued follow-through, especially in the form of more stocks reclaiming their 200-day moving averages and improving their 3-month performance.
For now, cautious optimism is warranted, with active traders finding more actionable setups, while longer-term investors may want to see further confirmation before committing more capital.
- Next to read: Market Monitor News May 14
NYSEARCA:IWM (5/14/2025, 1:04:10 PM)
207.463
-1.17 (-0.56%)
NASDAQ:QQQ (5/14/2025, 1:04:10 PM)
517.92
+2.33 (+0.45%)
NYSEARCA:SPY (5/14/2025, 1:04:10 PM)
587.38
+0.54 (+0.09%)
Find more stocks in the Stock Screener
IWM Latest News and Analysis
 12 hours ago - ChartmillMarket Monitor Trends (SPY, QQQ, IWM) and Breadth May 14
Over the past several trading sessions, market breadth has shown a clear and encouraging shift toward strength, particularly in the short to medium term.
