Consider SUPER MICRO COMPUTER INC (NASDAQ:SMCI) as an affordable growth stock, identified by our stock screening tool. SMCI is showcasing impressive growth figures and is well-positioned in terms of profitability, solvency, and liquidity. Moreover, it seems to be priced reasonably. Let's dive deeper into the analysis.
How do we evaluate the Growth for SMCI?
ChartMill assigns a proprietary Growth Rating to each stock. The score is computed by evaluating various growth aspects, like EPS and revenue growth. We take into account the history as well as the estimated future numbers. SMCI was assigned a score of 8 for growth:
- The Earnings Per Share has grown by an impressive 85.95% over the past year.
- Measured over the past years, SMCI shows a very strong growth in Earnings Per Share. The EPS has been growing by 66.56% on average per year.
- Looking at the last year, SMCI shows a very strong growth in Revenue. The Revenue has grown by 125.01%.
- Measured over the past years, SMCI shows a very strong growth in Revenue. The Revenue has been growing by 33.76% on average per year.
- The Earnings Per Share is expected to grow by 24.03% on average over the next years. This is a very strong growth
- The Revenue is expected to grow by 9.60% on average over the next years. This is quite good.
Valuation Examination for SMCI
ChartMill assigns a Valuation Rating to every stock. This score ranges from 0 to 10 and evaluates the different valuation aspects and compares the price to earnings and cash flows, while taking into account profitability and growth. SMCI scores a 6 out of 10:
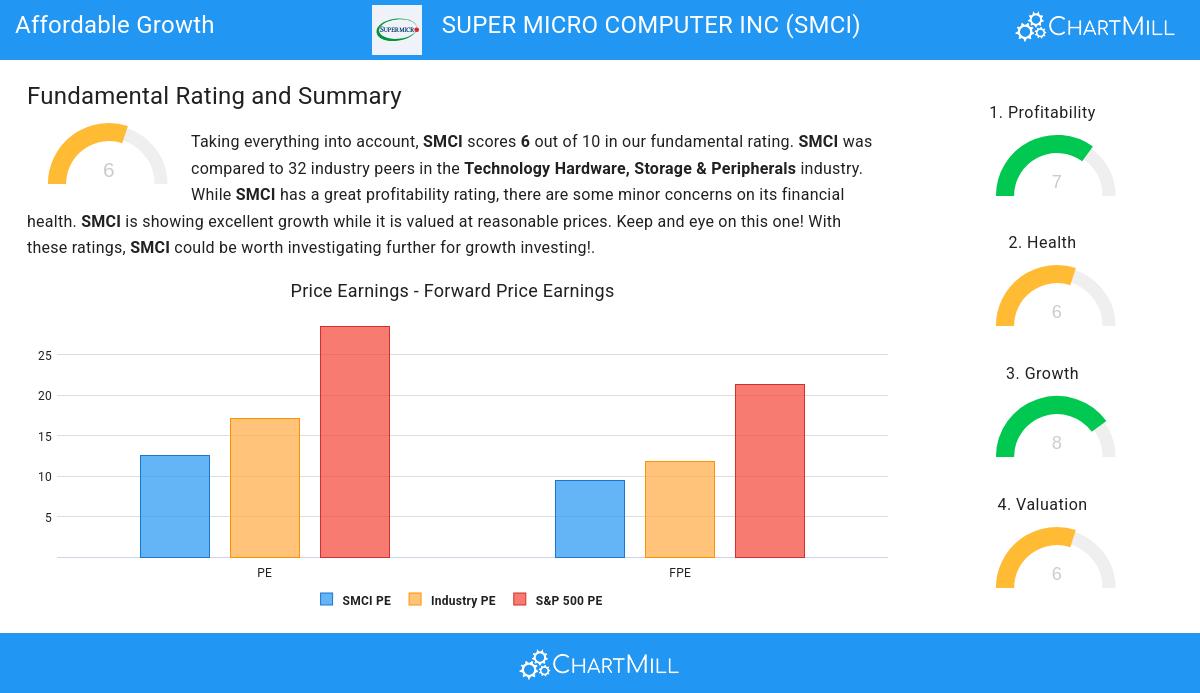
- SMCI's Price/Earnings ratio is a bit cheaper when compared to the industry. SMCI is cheaper than 65.63% of the companies in the same industry.
- The average S&P500 Price/Earnings ratio is at 28.55. SMCI is valued rather cheaply when compared to this.
- Based on the Price/Forward Earnings ratio of 9.41, the valuation of SMCI can be described as reasonable.
- SMCI's Price/Forward Earnings ratio is a bit cheaper when compared to the industry. SMCI is cheaper than 65.63% of the companies in the same industry.
- Compared to an average S&P500 Price/Forward Earnings ratio of 21.37, SMCI is valued rather cheaply.
- SMCI's low PEG Ratio(NY), which compensates the Price/Earnings for growth, indicates a rather cheap valuation of the company.
- SMCI has a very decent profitability rating, which may justify a higher PE ratio.
- A more expensive valuation may be justified as SMCI's earnings are expected to grow with 24.03% in the coming years.
Looking at the Health
ChartMill assigns a Health Rating to every stock. This score ranges from 0 to 10 and evaluates the different health aspects like liquidity and solvency, both absolutely, but also relative to the industry peers. SMCI scores a 6 out of 10:
- An Altman-Z score of 7.42 indicates that SMCI is not in any danger for bankruptcy at the moment.
- SMCI's Altman-Z score of 7.42 is amongst the best of the industry. SMCI outperforms 90.63% of its industry peers.
- SMCI has a Debt/Equity ratio of 0.28. This is a healthy value indicating a solid balance between debt and equity.
- With a decent Debt to Equity ratio value of 0.28, SMCI is doing good in the industry, outperforming 62.50% of the companies in the same industry.
- A Current Ratio of 6.38 indicates that SMCI has no problem at all paying its short term obligations.
- SMCI has a better Current ratio (6.38) than 96.88% of its industry peers.
- A Quick Ratio of 3.73 indicates that SMCI has no problem at all paying its short term obligations.
- SMCI has a better Quick ratio (3.73) than 96.88% of its industry peers.
Profitability Analysis for SMCI
ChartMill assigns a Profitability Rating to every stock. This score ranges from 0 to 10 and evaluates the different profitability ratios and margins, both absolutely, but also relative to the industry peers. SMCI scores a 7 out of 10:
- SMCI has a better Return On Assets (14.85%) than 93.75% of its industry peers.
- With an excellent Return On Equity value of 23.16%, SMCI belongs to the best of the industry, outperforming 90.63% of the companies in the same industry.
- SMCI's Return On Invested Capital of 16.62% is fine compared to the rest of the industry. SMCI outperforms 75.00% of its industry peers.
- SMCI had an Average Return On Invested Capital over the past 3 years of 20.63%. This is significantly above the industry average of 15.58%.
- The 3 year average ROIC (20.63%) for SMCI is well above the current ROIC(16.62%). The reason for the recent decline needs to be investigated.
- Looking at the Profit Margin, with a value of 6.94%, SMCI is in the better half of the industry, outperforming 75.00% of the companies in the same industry.
- SMCI's Profit Margin has improved in the last couple of years.
- SMCI's Operating Margin has improved in the last couple of years.
Our Affordable Growth screener lists more Affordable Growth stocks and is updated daily.
For an up to date full fundamental analysis you can check the fundamental report of SMCI
Disclaimer
This article should in no way be interpreted as advice. The article is based on the observed metrics at the time of writing, but you should always make your own analysis and trade or invest at your own responsibility.