
Our stock screening tool has pinpointed PULTEGROUP INC (NYSE:PHM) as an undervalued stock option. PHM retains a strong financial foundation and an attractive price tag. Let's delve into the specifics below.
Assessing Valuation for PHM
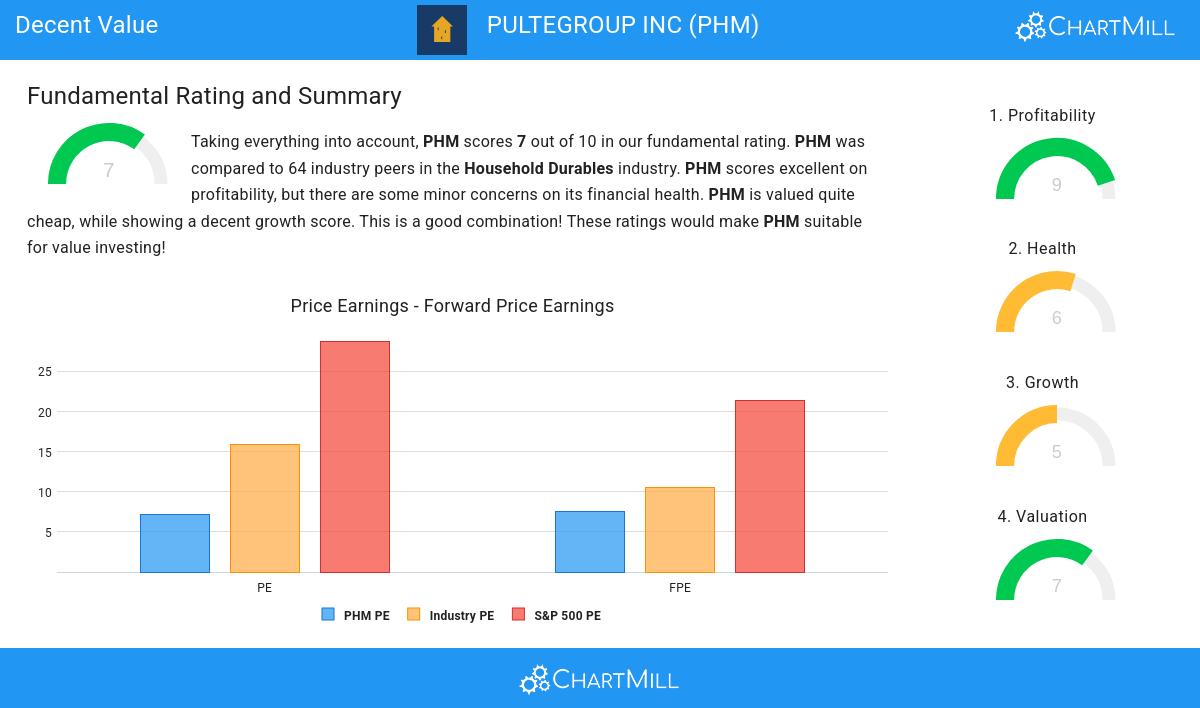
ChartMill provides a Valuation Rating to every stock, ranging from 0 to 10. This rating assesses various valuation aspects, comparing price to earnings and cash flows, while considering factors like profitability and growth. PHM boasts a 7 out of 10:
- The Price/Earnings ratio is 7.22, which indicates a rather cheap valuation of PHM.
- Based on the Price/Earnings ratio, PHM is valued a bit cheaper than 68.75% of the companies in the same industry.
- When comparing the Price/Earnings ratio of PHM to the average of the S&P500 Index (28.78), we can say PHM is valued rather cheaply.
- PHM is valuated cheaply with a Price/Forward Earnings ratio of 7.57.
- 71.88% of the companies in the same industry are more expensive than PHM, based on the Price/Forward Earnings ratio.
- When comparing the Price/Forward Earnings ratio of PHM to the average of the S&P500 Index (21.32), we can say PHM is valued rather cheaply.
- Based on the Enterprise Value to EBITDA ratio, PHM is valued cheaply inside the industry as 81.25% of the companies are valued more expensively.
- Based on the Price/Free Cash Flow ratio, PHM is valued a bit cheaper than 67.19% of the companies in the same industry.
- The excellent profitability rating of PHM may justify a higher PE ratio.
Profitability Analysis for PHM
ChartMill utilizes a Profitability Rating to assess stocks, scoring them on a scale of 0 to 10. This rating takes into account a variety of profitability ratios and margins, both in absolute terms and in comparison to industry peers. PHM has earned a 9 out of 10:
- With an excellent Return On Assets value of 16.98%, PHM belongs to the best of the industry, outperforming 95.31% of the companies in the same industry.
- PHM has a Return On Equity of 23.93%. This is amongst the best in the industry. PHM outperforms 87.50% of its industry peers.
- PHM has a better Return On Invested Capital (19.47%) than 95.31% of its industry peers.
- The Average Return On Invested Capital over the past 3 years for PHM is significantly above the industry average of 12.28%.
- The 3 year average ROIC (19.16%) for PHM is below the current ROIC(19.47%), indicating increased profibility in the last year.
- PHM has a Profit Margin of 16.45%. This is amongst the best in the industry. PHM outperforms 93.75% of its industry peers.
- In the last couple of years the Profit Margin of PHM has grown nicely.
- With an excellent Operating Margin value of 21.15%, PHM belongs to the best of the industry, outperforming 93.75% of the companies in the same industry.
- In the last couple of years the Operating Margin of PHM has grown nicely.
- PHM's Gross Margin has improved in the last couple of years.
Assessing Health Metrics for PHM
ChartMill employs a unique Health Rating system for all stocks. This rating, ranging from 0 to 10, is determined by analyzing various liquidity and solvency ratios. For PHM, the assigned 6 for health provides valuable insights:
- PHM has a debt to FCF ratio of 1.41. This is a very positive value and a sign of high solvency as it would only need 1.41 years to pay back of all of its debts.
- PHM has a better Debt to FCF ratio (1.41) than 76.56% of its industry peers.
- PHM has a Debt/Equity ratio of 0.17. This is a healthy value indicating a solid balance between debt and equity.
- PHM's Debt to Equity ratio of 0.17 is fine compared to the rest of the industry. PHM outperforms 68.75% of its industry peers.
- PHM has a Current Ratio of 4.82. This indicates that PHM is financially healthy and has no problem in meeting its short term obligations.
- PHM has a Current ratio of 4.82. This is in the better half of the industry: PHM outperforms 75.00% of its industry peers.
Growth Analysis for PHM
A key component of ChartMill's stock assessment is the Growth Rating, which spans from 0 to 10. This rating evaluates diverse growth factors, such as EPS and revenue growth, considering both past performance and future projections. PHM has received a 5 out of 10:
- PHM shows a strong growth in Earnings Per Share. In the last year, the EPS has been growing by 16.21%, which is quite good.
- Measured over the past years, PHM shows a very strong growth in Earnings Per Share. The EPS has been growing by 32.15% on average per year.
- The Revenue has grown by 8.86% in the past year. This is quite good.
- Measured over the past years, PHM shows a quite strong growth in Revenue. The Revenue has been growing by 11.94% on average per year.
Every day, new Decent Value stocks can be found on ChartMill in our Decent Value screener.
For an up to date full fundamental analysis you can check the fundamental report of PHM
Keep in mind
This is not investing advice! The article highlights some of the observations at the time of writing, but you should always make your own analysis and invest based on your own insights.