
For investors who use technical analysis to find possible opportunities, a frequent difficulty is locating stocks that are both in a solid uptrend and presenting a low-risk chance to buy. A systematic way to handle this is to look for stocks that have both a high technical health score and a high setup quality score. The first finds securities with solid and confirmed upward momentum, while the second points out those that are moving sideways in a narrow band, indicating a possible breakout may be near. This method tries to catch the next phase of a current trend by buying just as the stock leaves a quiet period.
Occidental Petroleum Corp (NYSE:OXY) recently appeared from such a search, showing a profile that fits this technical breakout approach.
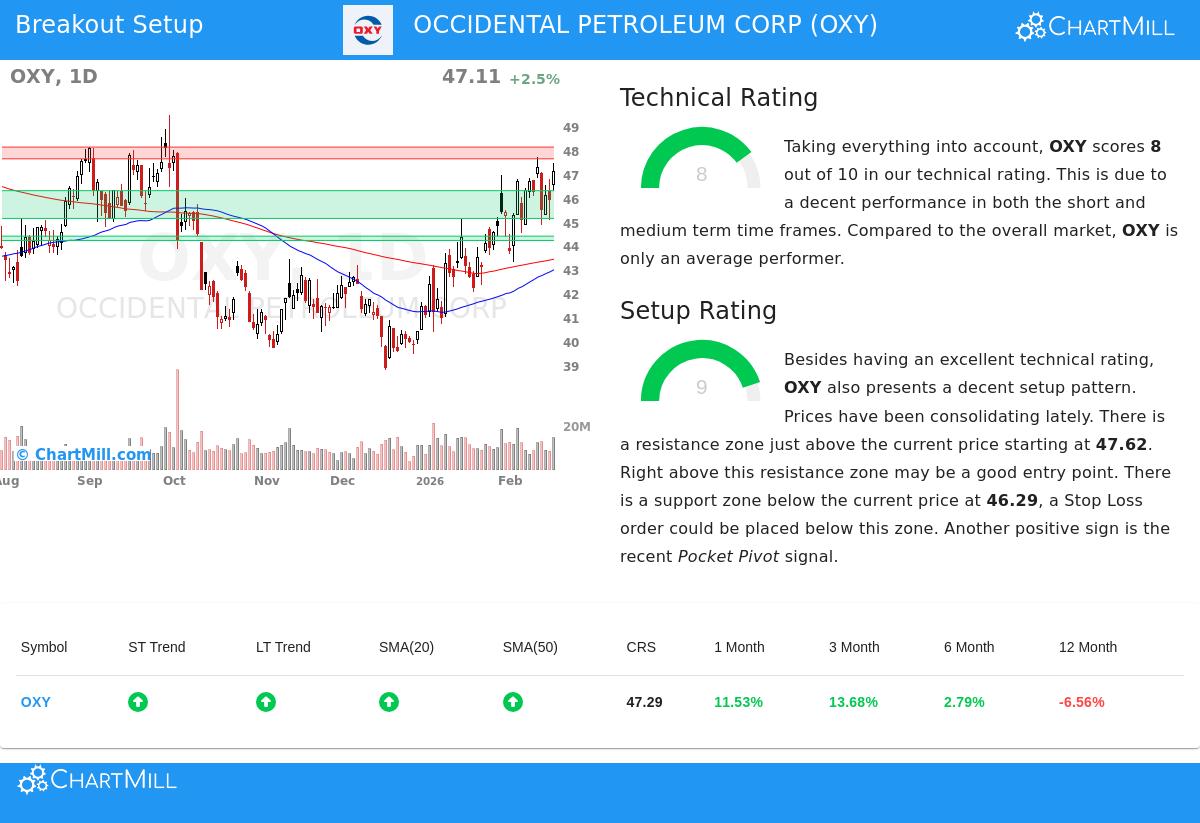
Technical Health: A Base of Strength
The first part of this method is finding a stock with good basic technicals, which shows continued buying interest and a sound trend. Based on the ChartMill Technical Report, OXY gets a good Technical Rating of 8 out of 10. This number comes from several positive parts that affirm the stock's bullish position across different time periods.
- Trend Agreement: Both the near-term and longer-term trends for OXY are marked as positive. This agreement is a strong sign, indicating momentum is not just temporary but part of a bigger, continued move.
- Moving Average Backing: The stock is priced above all its main simple moving averages (20, 50, 100, and 200-day), and each of these averages is also in a rising pattern. This forms a stacked support base under the price.
- Relative Performance: While OXY is trading in the higher part of its own 52-week range, its relative strength rating shows it is keeping pace with the wider market, which is also in a positive near-term trend. This means the stock is joining in the market's move upward rather than falling back.
A high technical rating is important because it answers the question, "Which stock should I buy?" It sorts for market leaders and stocks in verified uptrends, giving a positive setting for any breakout try.
Setup Quality: The Timing of the Entry
A solid trend by itself is not a signal to buy; entering at a high price can lead to quick losses. The second part concentrates on timing, looking for stocks that are "tightening" or moving sideways within their trend. OXY does well here too, having a Setup Quality Rating of 9 out of 10. This high number indicates the stock is forming a possible starting point.
- Sideways Pattern: The report states that OXY has been trading in a band between about $42.35 and $47.69 over the last month and is currently testing the top edge of this band. This kind of flat movement after a rise is typical resting behavior.
- Clear Resistance and Support: The analysis points out a definite resistance area between $47.62 and $48.11. A clear move above this area could mark the beginning of a new bullish period. On the other side, a firm support area exists between $45.13 and $46.29, giving a reasonable place to set a protective stop-loss order.
- Confirming Volume Activity: Very lately, the stock showed a "Pocket Pivot" signal, which is a volume-based sign of accumulation, or buying by bigger participants, during a price increase. This adds another piece of confirmation to the setup.
The setup quality rating speaks to the question, "When should I buy it?" It finds times of low movement and price tightening inside an uptrend, which often come before the next directional move. The clear resistance level gives a specific point for entry, while the close support allows for careful risk control.
A Possible Trading Plan
Based on this technical picture, the analysis proposes a specific, though only example, setup. A breakout above the resistance area, specifically above $48.12, could be used as an entry signal. A stop-loss order set below the main support area near $45.12 would set the trade's risk, coming to about 6.2% of the entry price. This makes a plan with a clearly defined point of failure, which is necessary for handling capital.
Find More Technical Breakout Ideas
The pairing of a solid trend and a high-quality setup is what technical traders look for. OXY is one case found by a systematic filter. For investors wanting to find similar chances each day, the Technical Breakout Setups screen scans the market for stocks that fit these exact needs of a Technical Rating >=7 and a Setup Rating >7.
Disclaimer: This article is for information only and is based on a technical analysis model. It is not investment advice, a suggestion, or an offer to buy or sell any security. The described trade setup is an automatic, example case. Investors should do their own study, think about their personal money situation and risk comfort, and talk with a qualified financial advisor before making any investment choices. Past results do not guarantee future outcomes.