
For technical investors looking to find stocks ready for their next rise, a frequent plan joins two main ideas: the general condition of a stock's trend and the state of its present pause pattern. A stock in a firm, clear uptrend is better, but purchasing at the top of an advance can be dangerous. The best moment to enter usually arrives after a time of sideways action, or a pause, which lets the stock absorb its increases and form a foundation for a possible upward move. This process is exactly what tools like ChartMill's Technical Rating and Setup Quality Rating try to measure, assisting traders in finding chances where solid trends and good patterns meet.
Newmont Corp (NYSE:NEM), the world's top gold producer, now offers a clear example for this method. A recent search for technical upward move setups has noted NEM, and a closer review of its technical report shows why it is notable.
Technical Strength: A Base of Momentum
The base of any upward move candidate is a clearly firm main trend. ChartMill's Technical Rating, which grades a stock's technical condition from 0 to 10, is made to find such market leaders. A high grade shows steady results across different time periods and better performance compared to the wider market.
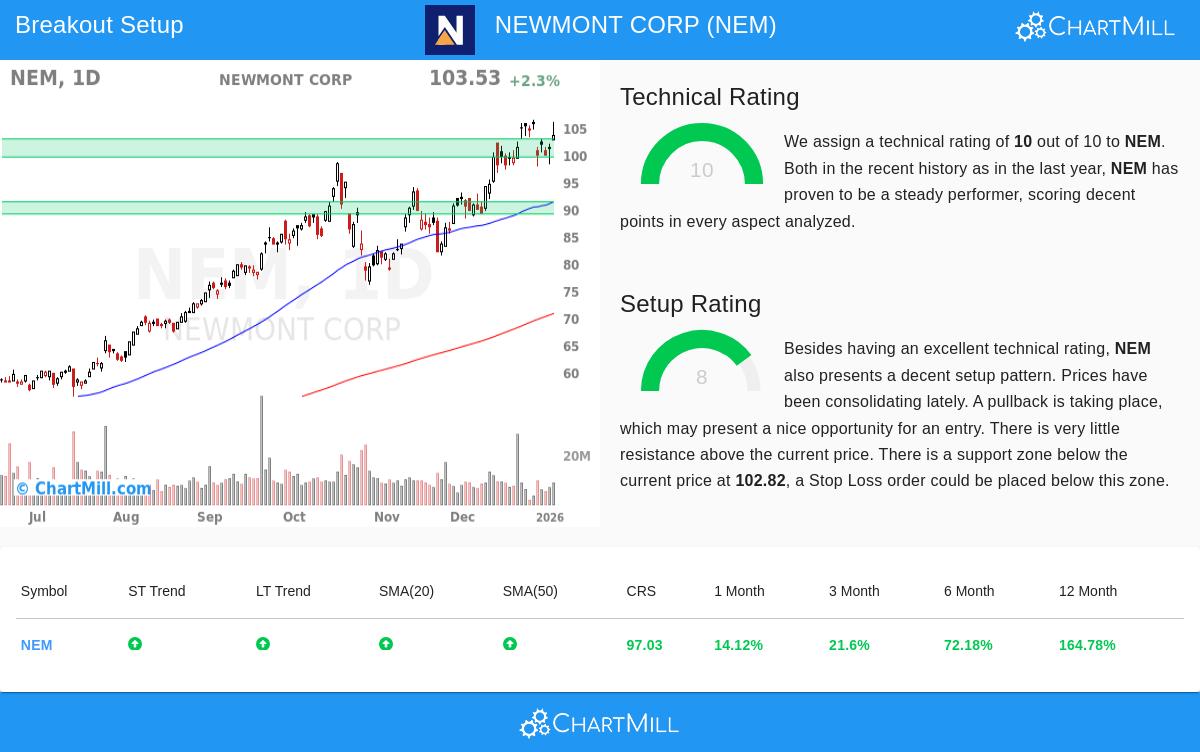
Newmont Corp receives a top Technical Rating of 10, putting it in the highest group of all stocks from a technical view. This grade is backed by several strong points listed in the full technical report:
- Trend Agreement: Both the long-term and short-term trends for NEM are graded as positive. This agreement shows continued buying interest without major disagreement between different time frames.
- Notable Relative Performance: The stock is doing better than 97% of all stocks in the market over the last year. More exactly, inside the competitive Metals & Mining industry, it tops 72% of its 157 competitors. This verifies its condition is not only a sector-wide event but a notable performance.
- Price Location vs. Moving Averages: NEM is trading well above all its main simple moving averages (20, 50, 100, and 200-day), and each of these averages is itself in a rising state. This layered agreement of support levels is a standard sign of a firm uptrend.
- Nearness to Highs: The stock is now trading close to its 52-week high of $106.34, showing its ability to keep its condition at higher levels.
This solid technical background is key for the upward move plan because it raises the chance that a move above resistance will be maintained and not quickly undone. A stock with poor technicals might "move up" only to fall soon; NEM's base points to a greater chance of continued movement.
Setup Quality: The Pattern for a Possible Upward Move
While a firm trend is needed, it is not enough for a best entry. A stock can be stretched, making a sensible stop-loss level hard to set. This is where the Setup Quality Rating becomes very useful. It grades the state of a stock's present pause pattern, searching for narrow, steady trading ranges that often come before clear moves.
Newmont Corp has a Setup Rating of 8, showing a good pause is present. The technical report states that prices have been pausing inside a range over the last month, which is just the sort of action this rating aims to find.
Main parts of the setup contain:
- Pause After Rise: After a notable rally, the stock has started a period of back-and-forth trading, letting it reduce any stretched conditions and create a new base of support.
- Clear Support Area: The analysis finds a main support area between $99.48 and $102.82, made by a joining of trendlines and moving averages. A clear support level is necessary for risk control, as it gives a logical place to set a protective stop-loss order.
- Little Overhead Resistance: With the stock near its highs, there is very little chart-based resistance directly above the present price. This absence of supply can permit a clearer and possibly quicker advance if an upward move is started.
The joining of a top Technical Rating (10) and a high Setup Rating (8) is what makes NEM a candidate for technical upward move investors. The firm trend gives the directional bias and condition, while the good setup offers a clear, lower-risk entry point just as the stock seems to be tightening for its next action.
A Sample Trading Plan
Using this analysis, the technical report presents a possible trading plan. It suggests an entry on a buy-stop order at $106.35 (just above the recent pause high) with a stop-loss order set at $99.47 (below the found support area). This would set a risk of about 6.5% on the trade. It is very important to note that this is an automated example for explanation. Any trading choice must be based on a person's own study, risk comfort, and knowledge of coming company events like earnings reports.
Finding More Chances
The search that found Newmont Corp is done each day, sorting the market for other stocks that show this strong joining of firm technicals and good setups. Investors wanting to see the present list of possible upward move candidates can view it directly through the Technical Breakout Setups screen.
Disclaimer: This article is for information and learning only. It is not meant as investment guidance, a suggestion, or an offer or request to buy or sell any securities. The study shown is based on technical measures and should not be the only base for any investment choice. Always do your own complete research, think about your money situation and risk comfort, and talk with a qualified financial advisor before making any investment. Past results are not a guide for future results.