
For investors looking for a structured method toward the market, blending fundamental and technical analysis can provide a solid framework. One specific tactic uses filters to find solid growth stocks that also display positive technical breakout formations. The reasoning has two parts: first, to find companies with sound core business condition and speeding earnings, and second, to pinpoint possible entry points when the stock's price movement indicates a change in momentum. This tactic tries to join the longer-term potential of a good business with the nearer-term signal of a technical formation, looking for situations where better fundamentals and price behavior might come together.
MICROSOFT CORP (NASDAQ:MSFT) appears from this filtering process, offering a situation where notable fundamental force differs with a recent phase of technical sideways movement, possibly preparing for its next significant price change.
Fundamental Force: The Base of Growth
Fundamentally, the filtering tactic focuses on companies that are financially sound and growing profitably. Microsoft’s fundamental picture, as shown in its ChartMill Fundamental Analysis Report, is strong in these aspects. The company receives a good total fundamental score of 7 out of 10, constructed on foundations of notable profitability and financial soundness.
- Profitability (Score: 8/10): Microsoft runs with sector-leading margins. Its Return on Invested Capital (ROIC) of 21.86% and Operating Margin of 46.67% are better than most of its software industry competitors. This shows a very efficient business structure able to turn revenue into significant profit.
- Financial Soundness (Score: 8/10): The company’s balance sheet is solid. With a low Debt-to-Equity ratio of 0.23 and an Altman-Z score showing no bankruptcy danger, Microsoft has the financial strength to invest over time and handle economic shifts.
- Growth (Score: 7/10): Importantly for a growth filter, Microsoft shows forceful and steady expansion. Over the last year, Revenue increased by 16.67% and Earnings Per Share (EPS) rose by 23.83%. Analysts think this pace will persist, with future EPS growth estimated close to 19% each year.
This mix is central to the tactic: solid profitability makes sure the growth is high-grade and lasting, while very good financial soundness offers durability. It is the business foundation—a large addressable market, leading market position in cloud and productivity software, and skilled leadership—that allows these excellent measurable outcomes.
The Technical Formation: Sideways Movement Before a Move?
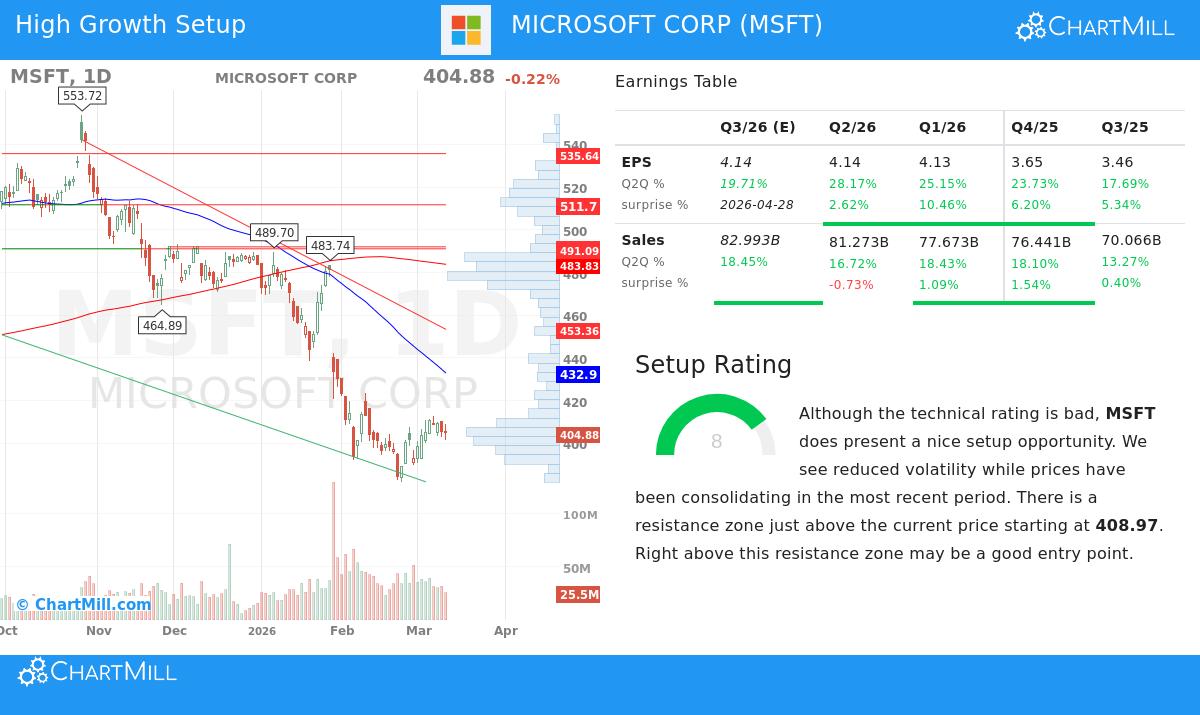
While the fundamentals show a successful business, the technical view has been more difficult. Based on the ChartMill Technical Analysis Report, the stock’s short and long-term trends are now negative, with the price trading much lower than its 52-week high and important averages like the SMA50 and SMA200.
Yet, inside this larger decline, the analysis finds a notable "formation" possibility, giving it a high Formation Score of 8 out of 10. The report mentions lower volatility and a phase of recent price sideways movement, creating what is called a possible bottom. A defined resistance area has formed just above the present price, beginning near $408.97.
This technical situation is exactly what the filtering method searches for. The tactic does not always look for stocks in strong uptrends; rather, it looks for fundamentally sound stocks that have experienced a phase of drop or sideways movement and are now displaying signals of steadiness, often close to clear resistance points. A clear move above such a resistance area on high volume could indicate a change of the short-term decline and the start of a new upward phase, providing a technically-marked entry point.
Valuation Setting
Microsoft’s valuation offers a blended picture, scoring a middle 4 out of 10. With a P/E ratio near 26, it trades similarly to the wider S&P 500 but at a lower price than its software industry competitors. The valuation score implies that while the stock is not low-priced in absolute terms, its higher price can be explained by its better profitability and anticipated growth rate—a common trait of high-grade growth stocks. For investors using this blended tactic, valuation is viewed alongside the growth and quality measures; a fair price for notable business results is often considered acceptable.
Conclusion
Microsoft stands as a notable example of the blended fundamental and technical method. The company’s top-tier profitability, strong balance sheet, and continuing double-digit growth meet the central "solid growth stock" requirements. At the same time, its recent price activity has created a sideways formation near a set resistance level, making a technical formation that traders monitor for a possible momentum change.
This combination indicates that MSFT is a stock where forceful business fundamentals and a possibly positive technical turning point might meet. Investors see a high-grade asset that, after a notable decline, is trying to form a bottom for its next rise.
Find Other Possibilities: The tactic that found Microsoft for this review can be used to find other possible candidates. You can use this "Solid Growth Stocks with good Technical Formation Scores" filter yourself and check the newest outcomes by using this link: View the Filtering Outcomes.
Disclaimer: This article is for informational purposes only and does not constitute financial advice, a recommendation, or an offer or solicitation to buy or sell any securities. The analysis is based on data and reports provided by ChartMill, and past performance is not indicative of future results. Investors should conduct their own research and consider their individual financial circumstances before making any investment decisions.