
The investment philosophy of legendary fund manager Peter Lynch focuses on finding well-run, growing companies available at sensible prices—a strategy often called Growth at a Reasonable Price (GARP). Lynch supported a long-term, buy-and-hold method, concentrating on fundamental health and lasting growth instead of market timing. His process applies specific financial filters to locate companies with strong profitability, good balance sheets, and earnings growth that is solid but not too high, confirming it can continue. A stock that meets this test justifies further examination from investors looking for lasting compounding returns.
Looking at META Against Lynch's Main Rules
META PLATFORMS INC-CLASS A (NASDAQ:META) results from a screen constructed on Peter Lynch's ideas. The company's financial picture matches the important quantitative rules Lynch highlighted for finding quality growth at a fair valuation.
- Lasting Earnings Growth: Lynch wanted companies with a confirmed history of growth, but he was cautious of extreme growth that could not be maintained. The screen looks for a 5-year average annual EPS growth between 15% and 30%. META's EPS has increased at a notable average rate of 24.85% over the last five years, putting it clearly inside this preferred range. This shows a steady and reliable rise in profitability.
- Fair Valuation (PEG Ratio): Possibly the central part of Lynch's valuation method is the Price/Earnings to Growth (PEG) ratio, which tries to relate a stock's P/E ratio to its growth rate. Lynch liked companies with a PEG ratio of 1 or lower, hinting the market might not completely account for the growth path. META's PEG ratio, calculated from its past five-year growth, is 0.83, satisfying this important condition for seeming fairly valued compared to its historical growth.
- Financial Health and Profitability: Lynch demanded companies with good balance sheets and high returns on capital.
- Debt/Equity Ratio: A small debt load was essential. Lynch liked a ratio under 0.25, but the screen uses a limit of 0.6. META's Debt/Equity ratio of 0.27 is very good, showing little dependence on debt financing and notable financial strength.
- Current Ratio: To make sure short-term bills can be paid without trouble, the screen selects for a Current Ratio of at least 1. META's ratio of 2.60 shows sufficient liquidity.
- Return on Equity (ROE): High ROE points to efficient use of shareholder money. The screen needs ROE above 15%. META's ROE of 27.83% is outstanding, indicating the company produces significant profit from each dollar of equity.
A Broad Fundamental View
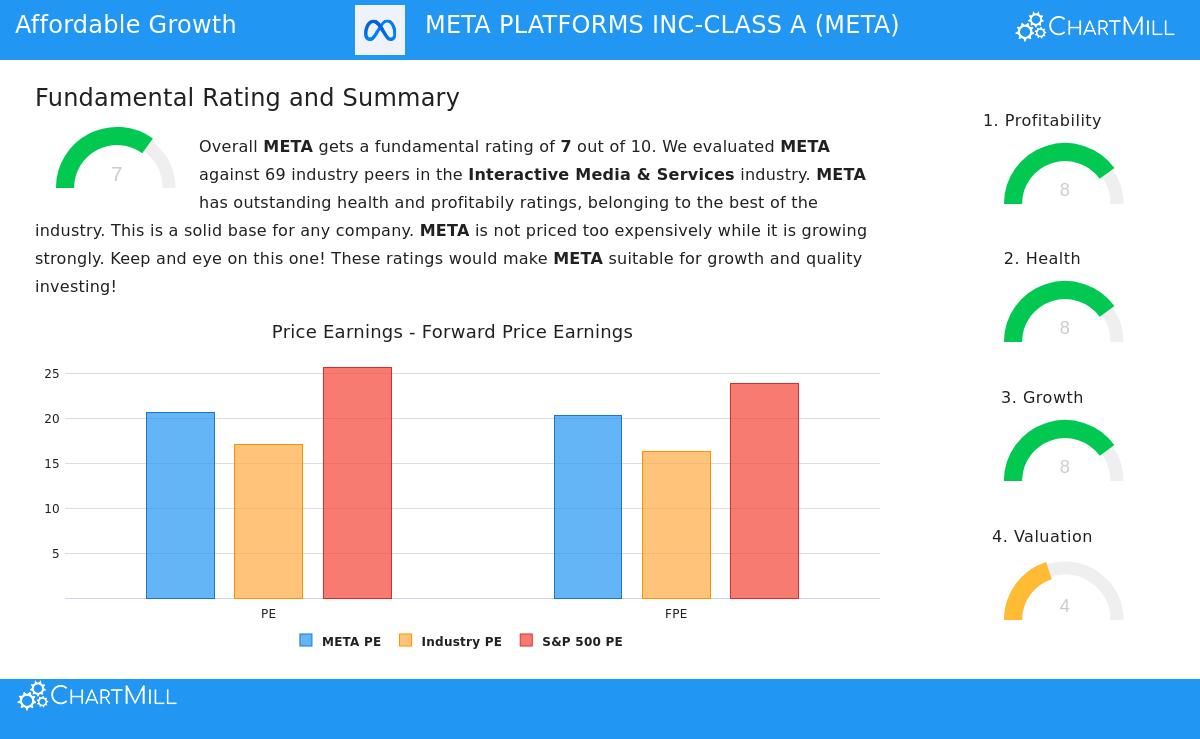
A wider fundamental review of META supports the image shown by the Lynch screen. The company receives a good total fundamental rating, with specific high points in profitability and financial health. Its profit margins are some of the best in the Interactive Media & Services industry, and its return on invested capital (ROIC) above 20% signals very efficient capital use. The health rating is supported by a strong cash position and a regular history of share buybacks—an action Lynch approved. While the standard P/E ratio might not look inexpensive alone, the high growth and profitability measures give perspective. You can see the complete fundamental report for META here.
Fit with the GARP Philosophy
For investors looking for growth at a fair price, META offers a strong example. It is not a speculative, unknown company—it is a leading force in its field. However, the Lynch-based review indicates its market price may not completely match its lasting competitive strengths, excellent profitability, and a growth rate that stays solid yet seems maintainable. The mix of high returns on capital, a very strong balance sheet with little debt, and a PEG ratio under 1 forms a profile that fits the long-term, quality-growth investing Lynch supported. It shows finding a "good company" first, and then deciding if it is a "good price."
Locating More Options
The Peter Lynch strategy is a structured way to find possible investments. META is one instance that satisfied the screen's filters. Investors curious about finding other companies that meet these strict rules can inspect the full screen and its outcomes through this link: View the Peter Lynch Strategy Stock Screen.
Disclaimer: This article is for information only and is not financial advice, a suggestion, or an offer to buy or sell any security. The review is based on particular screening rules and current data. Investors should perform their own complete research and think about their personal financial situation and risk tolerance before making any investment choices. Past results do not guarantee future outcomes.