
For investors looking for a dependable source of passive income, a methodical selection process is necessary to distinguish truly lasting dividend payers from risky high-yield situations. A typical and careful method involves selecting for companies that have both a good dividend history and show firm core business condition and earnings power. This method tries to find firms with the monetary capacity to keep and possibly increase their distributions over the long term, instead of those presenting high yields that may not last. One stock that appears from this type of filter is Lennar Corp. (NYSE:LEN).
Examining the Dividend Details
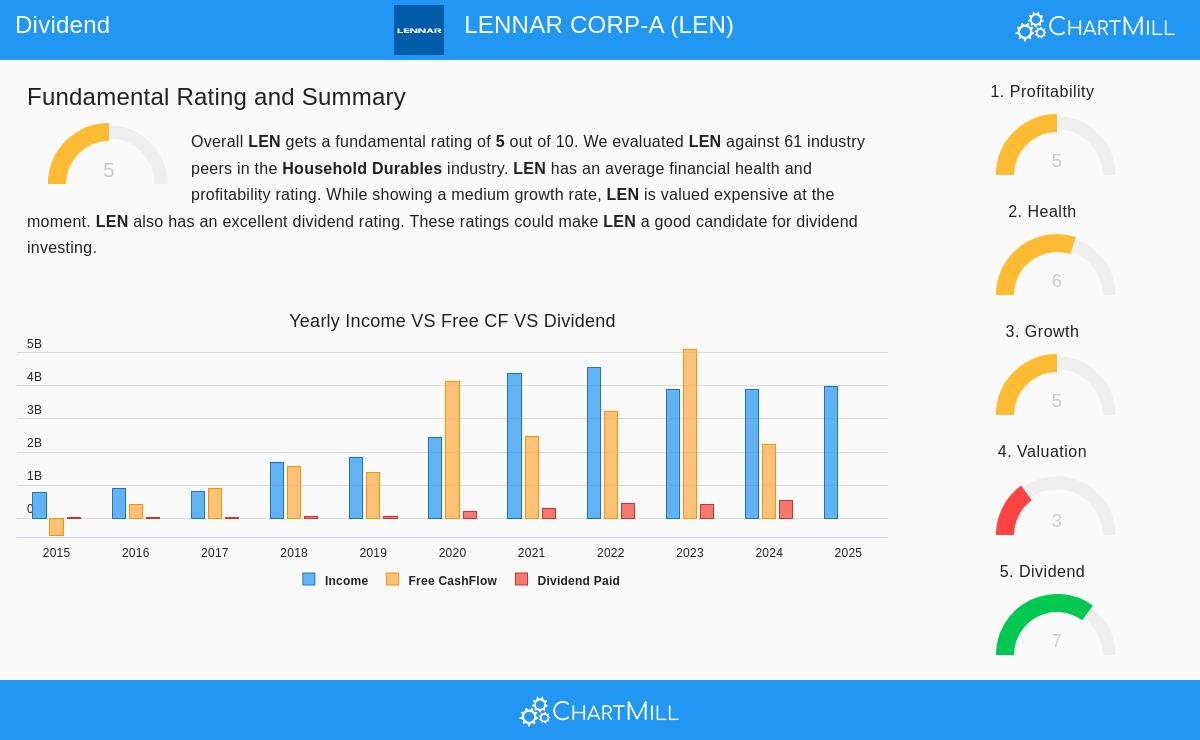
Lennar’s attraction for dividend investors is based on its firm ChartMill Dividend Rating of 7 out of 10. This rating combines a number of important measures into one, practical score. For those focused on income, the present yield of 1.91% is a good beginning, clearly higher than the 1.20% average for its sector. More significant than the current yield, however, is the company’s notable history and increase.
- Dependable History: Lennar has distributed a dividend for at least ten straight years and has not cut it in that time. This steadiness is a sign of dividend dependability, pointing to a corporate dedication to giving capital back to shareholders.
- Notable Increase: The yearly dividend increase rate is a firm 65.54% over the last five years. While such a fast speed may not last forever, it shows a policy of aggressive capital return in recent periods.
- Lasting Payout: A crucial test for any dividend stock is the payout ratio. Lennar uses only 19.91% of its earnings on dividends, a very small and careful ratio. This gives a large safety margin, meaning the present dividend is very safe even if earnings experience short-term challenges.
Supporting Business Basics: Earnings Power and Monetary Condition
A good dividend rating by itself is insufficient; it must be backed by a workable business. This is where the selection standards for acceptable earnings power and condition become important. They make sure the dividend is not being funded from weak foundations or too much borrowing. Lennar’s basic report shows an even profile here.
The company’s ChartMill Profitability Rating of 5 shows a varied but sufficient situation. Important positives contain a Return on Assets of 7.62% and an Operating Margin of 10.61%, both of which are better than many industry competitors. Still, investors should be aware of the noted drop in operating margin and a gross margin that is lower than most rivals. These items moderate the earnings power score but do not weaken the central capability to produce profits to support the dividend.
Maybe more critical for dividend continuity is monetary condition, where Lennar receives a ChartMill Health Rating of 6. The balance sheet shows notable firmness, especially in cash availability:
- A very strong Current Ratio of 9.39, meaning more than enough resources to meet near-term responsibilities.
- A workable Debt-to-Equity ratio of 0.24, showing little dependence on borrowed money.
- A good Altman-Z score of 4.06, which indicates a very small short-term chance of monetary trouble.
This mix of high cash availability and low debt need means Lennar has the monetary room to manage economic changes without threatening its dividend payments.
Price and Increase Background
From a price perspective, Lennar trades at a P/E ratio of 13.15, which is similar to its industry group but is lower than the wider S&P 500. More significantly, analysts forecast strong earnings increase of almost 26% on average for the next few years. This future increase possibility helps support the price and, critically, backs the argument for ongoing dividend continuity. If earnings increase as expected, the already-small payout ratio could become even more secure.
Is Lennar Suitable for a Dividend Portfolio?
Lennar Corp. offers a strong example of a stock that meets a strict dividend-oriented filter. It joins a good and increasing yield with a perfect payment history and a very safe payout ratio. These positive dividend traits are supported by a basically sound business with firm cash availability, little debt, and sufficient earnings power. This match is precisely what the selection method looks for: a dividend that is not merely high, but is backed by the monetary capacity to persist.
For investors using this method, Lennar represents a candidate deserving of more study, especially for those aware of the cyclical character of the homebuilding sector. The company’s firm balance sheet places it to manage industry slowdowns, while its dedication to shareholder returns is clearly shown.
Interested in finding other stocks that meet similar standards for dividend quality, earnings power, and monetary condition? You can use the "Best Dividend Stocks" filter yourself to see the complete list of present candidates here.
Disclaimer: This article is for informational purposes only and does not constitute financial advice, a recommendation, or an offer or solicitation to buy or sell any securities. The analysis is based on current data and past performance, which is not indicative of future results. Investors should conduct their own research and consult with a qualified financial advisor before making any investment decisions.