US Market Update
By Mill Chart
Last update: Sep 19, 2021
Since the beginning of September, we have seen predominantly red trading days on the charts of the major US indices. But does this mean that we are at the beginning of a new long-term downtrend or is this yet another dip in the long-term uptrend? Who will tell?
One thing is for sure, no one knows the right answer. But trying to look at things in a broader context might not be a bad idea... Keeping an overview and trying to see the bigger picture is important for anyone involved in investing anyway. At ChartMill, we have developed a simple trend indicator, which we apply to the weekly charts of the four main US index ETFs, being the QQQ, DIA, IWM AND DIA. Regular zooming out and looking at the big picture can help tremendously in putting certain elements in the right perspective. Such as the price development since September 1, for example....
With the Fear & Greed Index at 34, there are apparently some market participants who are getting nervous... Perhaps they should take some time to look at the weekly charts? All that can be said so far is that the bullish price trend is still intact.
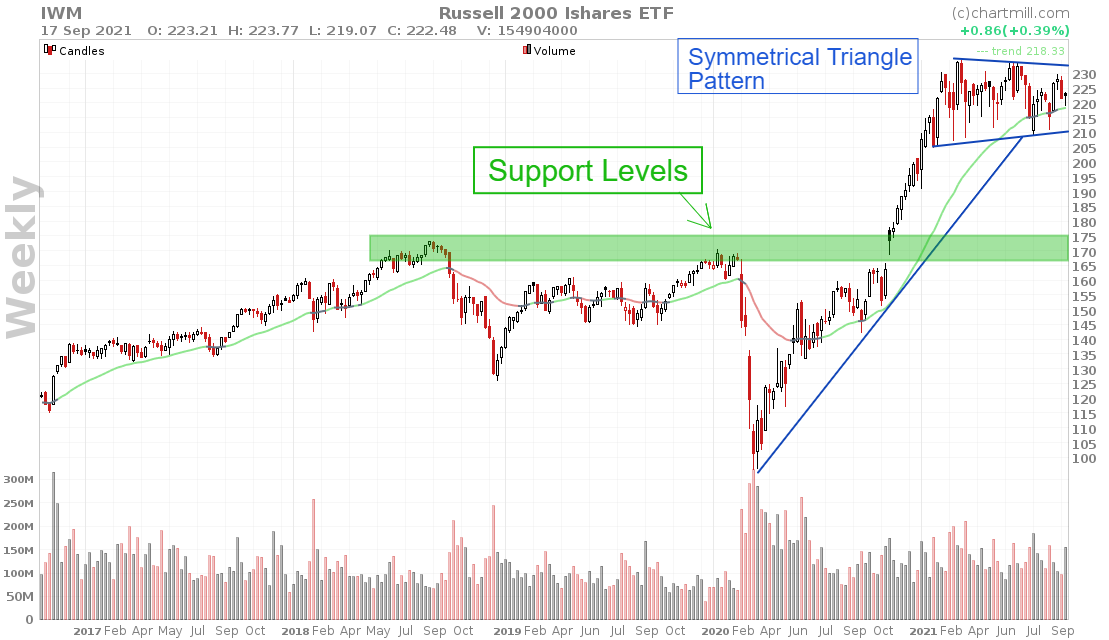
Only for the IWM ETF there are some slight signs of 'trend fatigue' with the price caught in a sideways price channel. The ATH has been there since February 2021.
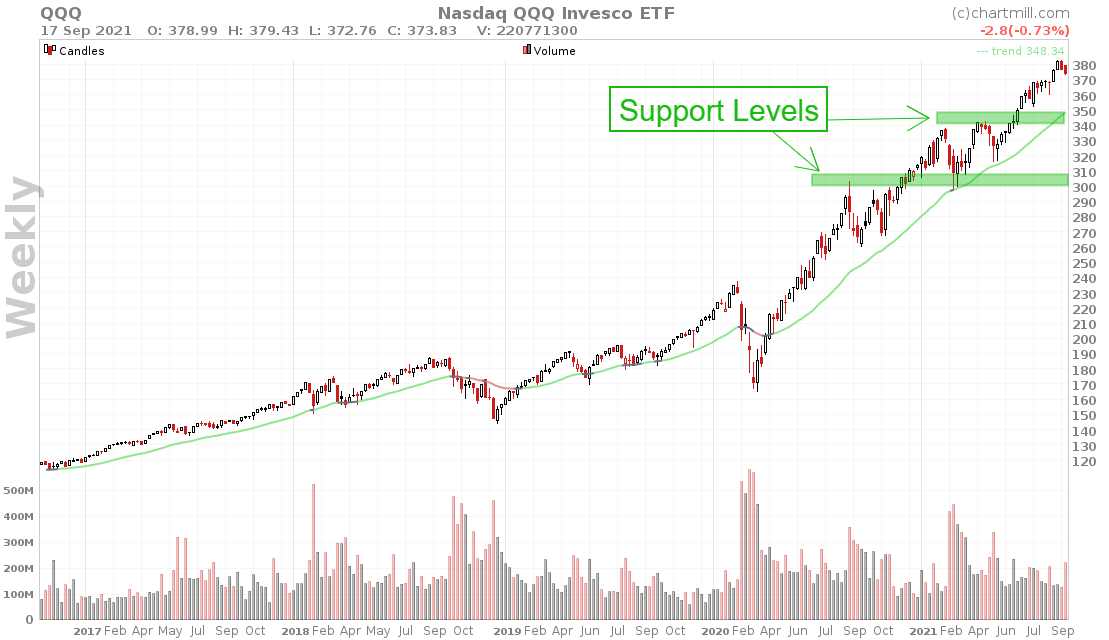
For the QQQ, it is notable that the price is quite a bit higher than the ChartMIll Trend Indicator. In order to maintain a healthy bullish trend, it would not be a bad thing if the market cooled down a bit.
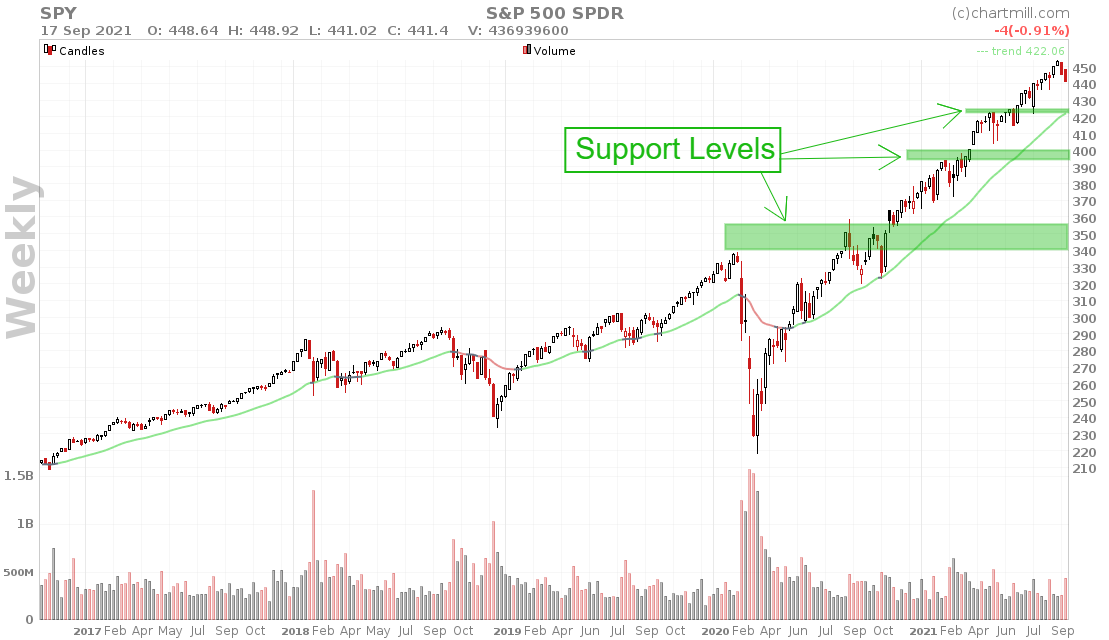
The situation with the SPY is similar to the QQQ. Yet where the QQQ still showed price dips in late February and mid-May, this is not the case with the SPY. There has been no price drop since early October 2020 worth the name.
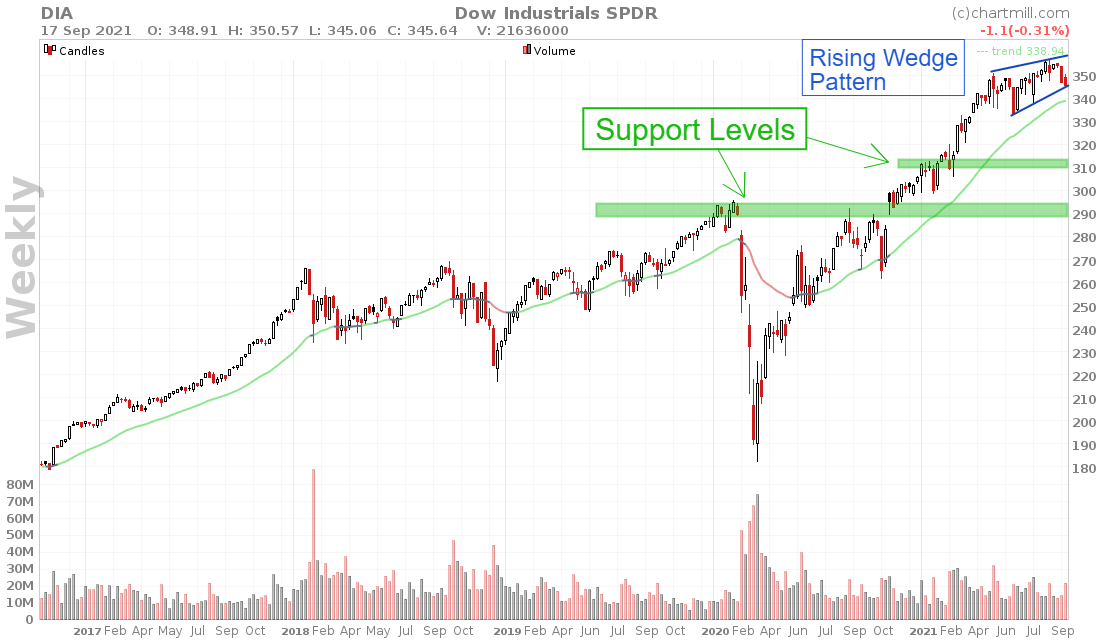
Finally, the DIA is having a hard time achieving any significant higher prices. The most recent top dates back to mid-August but the difference from the top in early May is very limited.
All things considered, there is absolutely no reason for panic or nervousness just yet. Of course, we are not going to deny that things can sometimes move very quickly in the financial markets. But there is no point in trying to anticipate the facts.
Selling long positions or already starting to speculate on further price declines with short positions is, in our opinion, way too early. Trying to predict the market is rarely a good idea. Just because the market has already risen significantly doesn't mean it can't rise further.
Predicting tops and bottoms correctly is, in the vast majority of cases, mostly due to "luck" anyway. Anyone who doubts this should ask the many shorters who have speculated on the end of the bull market since the last real temporary decline in March 2020… As far as we are concerned, the positive trend in all US indices is unchanged. The Chartmill Trend Indicator is rising and all ETFs are still trading above it.
Would you also like to keep an eye on the movement of the major US indices using our ChartMill Trend Indicator? Just click this link and save the screen as a watchlist in your ChartMill account!
Trade safe!
The ChartMill Team
![]()
![]()
![]()
![]()
250.79
+2.08 (+0.84%)
617.05
+7.94 (+1.3%)
680.59
+4.12 (+0.61%)
481.15
+0.64 (+0.13%)
Find more stocks in the Stock Screener
IWM Latest News and Analysis