
For technical investors, the search for promising opportunities often depends on identifying stocks that are not only in a strong uptrend but are also forming a constructive price pattern that suggests a potential breakout. One method to simplify this search is by using a Technical Breakout screen, which filters for stocks showing both sound underlying technical health and a high-quality setup pattern. This method aims to find securities that are positioned for their next move higher, offering a clear entry point with defined risk parameters. A recent scan using this method has highlighted Ionis Pharmaceuticals Inc (NASDAQ:IONS) as a stock deserving a closer look from a chart perspective.
A Strong Technical Foundation
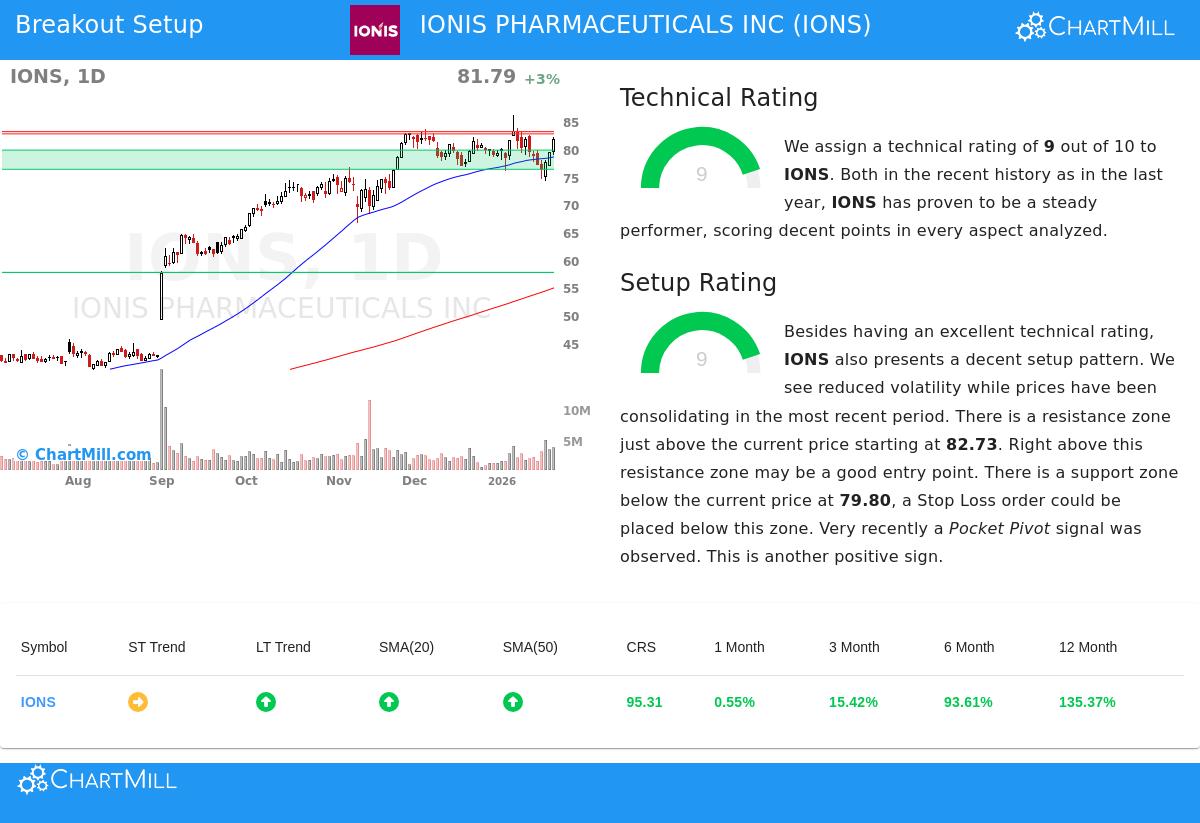
The center of any breakout strategy starts with a stock's underlying technical strength. Ionis Pharmaceuticals receives a top ChartMill Technical Rating of 9 out of 10, indicating very good technical health. This score comes from a multi-faceted study of trend, momentum, and relative performance.
- Strong Trend Alignment: The stock is in a confirmed long-term positive trend, with its price trading well above key moving averages like the 50-day ($78.58) and 200-day ($54.89). The short-term trend is currently neutral, which often comes before a resolution from a consolidation phase.
- Exceptional Relative Strength: IONS is doing better than 95% of all stocks in the market over the past year, a sign of true market leadership. Within its competitive Biotechnology industry, it does better than 85% of its 525 peers.
- Proximity to Highs: Trading near its 52-week high of $86.15, the stock shows an ability to keep momentum. This performance is in line with the broader market, as the S&P 500 is also near highs, but IONS's strength is notably more pronounced.
This sound technical background is important for the breakout strategy because it raises the chance that a move above resistance will be maintained, instead of failing into a broader downtrend. A detailed breakdown of these factors is available in the full ChartMill Technical Report for IONS.
A High-Quality Setup Pattern
While a strong trend is needed, it is not enough for a good trade. A stock must also present a workable entry point. This is where the Setup Quality Rating comes in, and IONS scores another 9 out of 10. This high score shows the stock is forming a constructive consolidation pattern, setting up for a potential breakout.
- Defined Trading Range: Over the past month, IONS has been consolidating within a range between about $74.20 and $86.15. This period of lower volatility and sideways action lets the stock absorb its prior gains and build a base for the next move.
- Clear Support and Resistance: The analysis finds a clear support zone between $76.33 and $79.80, formed by a mix of moving averages and trendlines. Just above the current price lies a defined resistance area between $82.73 and $83.17. These clear levels are needed for defining risk and reward.
- Supportive Market Action: A recent "Pocket Pivot" signal, a price advance on higher-than-usual volume, suggests accumulation by larger players during the consolidation, adding a positive detail to the setup.
This high setup quality is the second important pillar of the strategy. It answers the "when" to buy by identifying a moment of balance before a potential directional move, allowing for a disciplined entry with a logical stop-loss level placed below the support zone.
A Potential Trading Scenario
Based on this technical and setup analysis, a concrete scenario appears. The immediate resistance zone around $82.73-$83.17 represents a key hurdle. A clear move above this level could signal the restart of the primary uptrend.
- Potential Entry: A buy-stop order could be placed just above this resistance, at $83.18, to confirm the breakout has momentum.
- Defined Risk: A stop-loss order could be placed below the nearby support zone, around $76.32. This sets the maximum risk for the trade at about 8.25% from the entry point.
- Market Context: This setup happens as the S&P 500's short-term trend is positive, giving a generally supportive environment for breakout attempts.
It is important to remember that this is an example scenario created from technical patterns. Investors should always do their own analysis, consider fundamental factors like upcoming earnings or news, and adjust position sizing to their individual risk tolerance.
Finding More Opportunities
The Technical Breakout screen that found Ionis Pharmaceuticals is a changing tool that scans the market daily for similar high-probability setups. For investors interested in finding other stocks currently showing strong technical ratings and high-quality setup patterns, new results can be viewed daily via the Technical Breakout Setups screen.
Disclaimer: This article is for informational purposes only and does not constitute investment advice, a recommendation, or an offer to buy or sell any security. The analysis is based on technical indicators and historical data, which are not guarantees of future performance. Investing involves risk, including the potential loss of principal. Always conduct your own research and consider consulting with a qualified financial advisor before making any investment decisions.