
IONIS PHARMACEUTICALS INC (NASDAQ:IONS) has become an interesting option for investors using systematic growth plans, joining Mark Minervini's strict trend-following system with high growth momentum filters. The selection process finds stocks displaying solid technical condition through Minervini's Trend Template standards while also showing fundamental improvement through earnings increases, revenue growth, and favorable estimate changes. This combined method aims to identify companies in clear uptrends with business improvement that could support further price gains.
Technical Condition and Trend Template Match
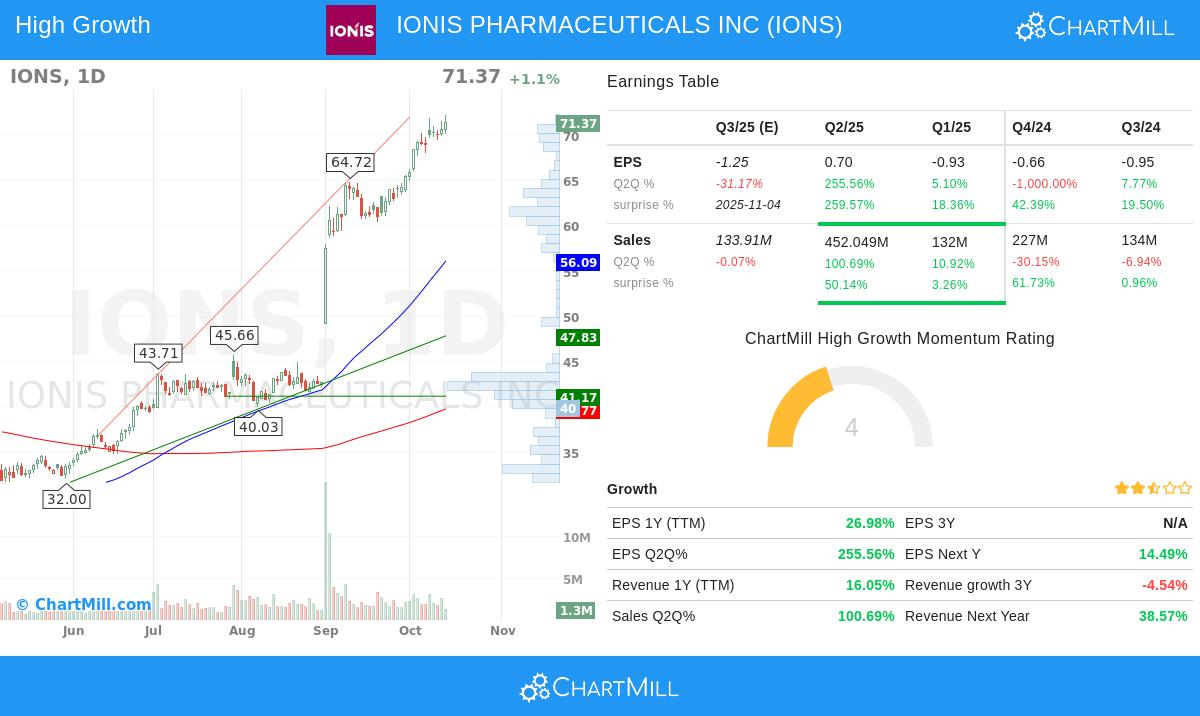
IONS shows very good technical features that match Minervini's Trend Template needs. The stock is now priced at $71.37, much higher than all important moving averages and displaying solid momentum over different periods. This placement meets the main technical screens that Minervini highlights for finding stocks in lasting uptrends.
The moving average arrangement shows a strongly positive structure:
- Current price ($71.37) is well above the 50-day SMA ($56.09), 150-day SMA ($42.02), and 200-day SMA ($39.77)
- All moving averages show upward angles, confirming continued buying interest
- The 50-day SMA is positioned well above both the 150-day and 200-day SMAs
- The 150-day SMA stays above the 200-day SMA
These moving average connections create the base of Minervini's trend finding system, making sure the stock shows strength over short, medium, and long-term periods. The arrangement points to institutional buying and lowers the chance of incorrect breakouts.
Momentum and Relative Strength Measurements
The stock's momentum features give more proof of its technical condition, with several measurements going beyond Minervini's lowest limits noticeably. The current price is about 198% higher than its 52-week low of $23.95 while being within 1.1% of its 52-week high of $72.15. This pairing of solid recovery from lows and nearness to new highs shows both continued buying activity and little overhead selling pressure.
The relative strength score of 94.55 is much better than Minervini's minimum need of 70, showing IONS is doing better than almost 95% of all market stocks. Inside the active biotechnology field of 536 firms, IONS is doing better than 88% of similar companies. This very good relative performance indicates the stock is acting as a market frontrunner instead of just following general field patterns.
Fundamental Improvement Speed
Besides technicals, IONS displays the fundamental speed that high growth momentum investors look for. The company's recent earnings show major progress, with quarterly EPS growth of 255.56% compared to the same quarter last year. This shows a notable speed increase from earlier quarters and points to possible fundamental change.
Revenue growth has also sped up, with the latest quarter showing 100.69% year-over-year growth compared to more moderate results in previous times. The company has shown regular skill to beat predictions, exceeding EPS forecasts in all of the last four quarters by an average of 84.95%. Revenue forecasts have been beaten in all four recent quarters too, with an average exceed of 29.02%.
Analyst Belief and Future View
The growth story gets more backing from analyst changes, with next-year EPS forecasts increasing 17.37% over the past three months and revenue forecasts going up 13.69%. These upward changes indicate growing belief in the company's growth path and often come before continued price gains as institutional investors update their valuation methods.
Profitability measurements show clear progress, with the most recent quarter reaching a 27.33% profit margin. This represents a major widening from past levels and suggests the company is successfully turning revenue growth into bottom-line outcomes. Free cash flow creation has gotten better by 40.61% over the past year, giving more fundamental support for the technical condition.
Technical Review Summary
According to ChartMill's technical review report, IONS gets a complete technical score of 10 out of 10, showing very good performance across both short and long-term periods. The report states the stock is reaching new 52-week highs along with the wider market, with both short-term and long-term trends scored as good. Performance measurements are strong across multiple timeframes, including 16.40% over one month, 70.91% over three months, and 151.30% over six months.
While the technical score is very good, the setup quality score of 3 suggests investors could think about waiting for possible price settling before starting new positions. The review finds three important support levels at $61.01, $47.83, and $41.17, which could give reasonable areas for risk planning.
View the complete technical analysis report for IONS
Investment Points
For investors following the Minervini method, IONS presents an interesting example of agreement between technical condition and fundamental speed. The stock meets all Trend Template standards while showing the earnings momentum and estimate change strength that high growth investors focus on. The pairing of technical leadership and fundamental betterment makes a strong setup, though the present stretched price activity indicates possible entry chances might appear during times of price settling.
The stock's activity within the wider market situation is notable, as it's reaching new highs together with the S&P 500, which now shows a good short-term trend even with a neutral long-term view. This connection with market leadership gives more support for the stock's technical qualifications.
Disclaimer: This analysis is for informational and educational purposes only and does not constitute investment advice. All investment decisions should be based on individual research and risk tolerance. Past performance does not guarantee future results. Please consult with a qualified financial advisor before making any investment decisions.