
For investors aiming to benefit from companies with strong expansion potential, a mixed technical and fundamental method can be especially effective. One tactic involves searching for stocks showing good underlying business growth, shown by increasing revenues and earnings, while also presenting favorable technical chart patterns that indicate a possible breakout. This technique tries to find companies where better business foundations might be close to being acknowledged by the wider market, possibly resulting in notable price gains. By selecting for good financial condition and earnings, the tactic also works to reduce risk, confirming the company has the financial strength to carry out its growth objectives.
INTUIT INC (NASDAQ:INTU) stands as a leading example for this kind of examination. The provider of financial software like TurboTax and QuickBooks seems to match the main principles of this growth-and-breakout tactic, offering a persuasive argument grounded in its latest reports.
Fundamental Strength: The Engine for Growth
The base of any growth investment is the company's financial results and future view. Intuit's fundamental picture, as described in its fundamental analysis report, reveals several important positives that are vital for a lasting growth story:
- Notable Historical Growth: The company has shown strong momentum in its main activities. Over the last year, revenue increased by 17.1% and earnings per share (EPS) rose by 23.9%. The longer-term history is also solid, with average yearly revenue growth of almost 20% over recent years.
- High Profitability and Efficiency: Intuit works with excellent margins, a signal of a durable competitive advantage and pricing ability. Its operating margin of 26.7% and return on equity of 21.3% place it with the best in the competitive software field. High earnings supply the money required to put back into new ideas and growth projects.
- Good Financial Health: With a solid ChartMill Health Rating of 7/10, Intuit keeps a balance sheet that can back its goals. The company has an acceptable debt level, with a Debt-to-Equity ratio of 0.28, and its Altman-Z score shows a very low short-term chance of financial trouble. This financial steadiness is a required condition, as it confirms the company can handle economic changes and keep financing its expansion.
While its price, with a P/E ratio over 30, is not low, it is key to see this in perspective. The rating is neutral compared to the wider S&P 500 and seems more acceptable next to its software industry counterparts. For a genuine growth stock, a higher price can be acceptable if backed by better and steady earnings growth, which Intuit's history and future projections indicate.
Technical Setup: Positioning for a Breakout
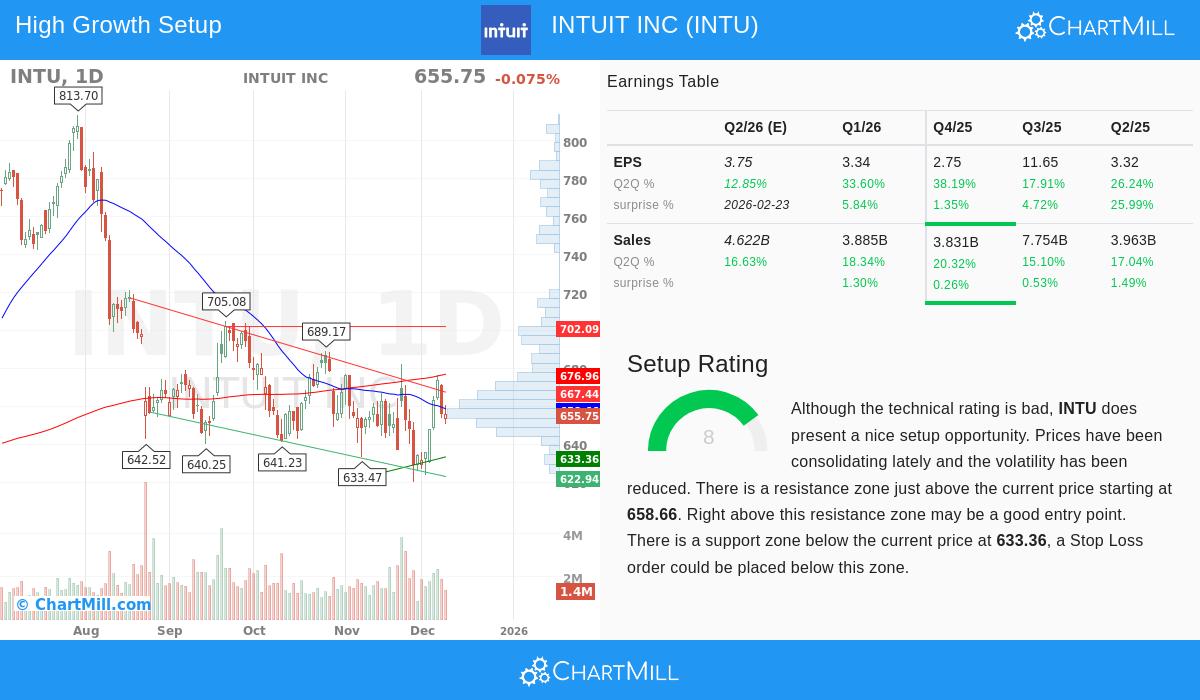
A good fundamental story needs a supportive technical view to indicate a possible entry point. According to Intuit's technical analysis report, the stock is now presenting a noticeable setup, receiving a high Setup Rating of 8/10.
- Consolidation Within a Range: After a time of decrease from its 52-week highs, INTU has been trading in a set range between about $620 and $682 over the past month. This consolidation stage shows a time of balance where selling force has lessened and the stock is forming a base.
- Nearness to Key Resistance: The stock is now trading close to the top part of this recent range, nearing an important resistance area between $658 and $674. This area is made by a combination of technical elements, including important moving averages and trendlines. In technical study, a clear move above such a multi-level resistance area on high volume can signal the beginning of a new upward trend, as it would show the taking in of all overhead supply.
- The Market Context: It is notable that while the S&P 500 has been trading near highs, Intuit has been trailing, trading in the middle of its yearly range. This difference can sometimes create a chance if the company's good fundamentals start to draw new investor attention, possibly starting a catch-up move.
This technical arrangement is exactly what the mixed tactic looks for: a fundamentally good growth stock that is pausing after a pullback and now shows signals of aiming to break out of a consolidation shape. The lower volatility during this base-forming stage, followed by a possible breakout, is a common pattern seen before important moves.
Conclusion: A Convergence of Factors
Intuit shows the kind of chance a mixed analytical method tries to find. The company is not a speculative story; it is an established leader showing:
- Strong, double-digit growth in both sales and earnings.
- Excellent profitability numbers that finance future projects.
- A very strong balance sheet that gives toughness.
These fundamental qualities meet the needed standards for a lasting growth investment. At the same time, the technical chart shows the stock may be finishing a needed consolidation stage, placing it for a possible breakout that could mark the start of its next step higher. For investors, this meeting suggests a moment where the market's technical force may be lining up with the company's fundamental force.
Interested in examining other stocks that match this profile of good growth combined with favorable technical setups? You can run the screen yourself using our Strong Growth Stock Technical Setups Screener.
Disclaimer: This article is for informational purposes only and does not constitute financial advice, a recommendation to buy or sell any security, or an endorsement of any investment strategy. All investing involves risk, including the potential loss of principal. Investors should conduct their own research and consider their individual financial circumstances before making any investment decisions.