
A strategy that combines basic strength with technical momentum gives investors a methodical way to spot possible opportunities. The "Strong Growth Stocks with good Technical Setup Ratings" screen specifically finds companies showing sound financial health and profitability while also displaying encouraging technical patterns that indicate possible breakouts. This method tries to find stocks set for growth because of their business basics while timing entries when technical signals indicate momentum could be increasing.
Fundamental Strength Assessment
INTUIT INC (NASDAQ:INTU) displays notable fundamental traits that match growth stock standards. The company's financial base shows why it meets strict fundamental screening criteria:
- Growth Rating: 7/10
- Profitability Rating: 8/10
- Health Rating: 7/10
The company's growth numbers show solid past performance with revenue increasing at 19.65% each year over recent years and earnings per share rising by 20.77% on average. This good past growth is supported by future estimates expecting 14.01% EPS growth and 12.29% revenue growth. For growth investors, these continued expansion rates show the company's capacity to regularly beat market averages.
Profitability is a clear strength, with INTU reaching:
- Return on Invested Capital: 15.18% (better than 91.46% of software industry peers)
- Operating Margin: 26.22% (better than 90.04% of industry competitors)
- Return on Equity: 19.63% (higher than 86.12% of software companies)
These numbers show the company's effective capital use and good competitive position in the software sector. The fundamental health rating of 7 reflects a steady balance sheet with acceptable debt levels and enough cash, lowering financial risk while supporting ongoing growth projects.
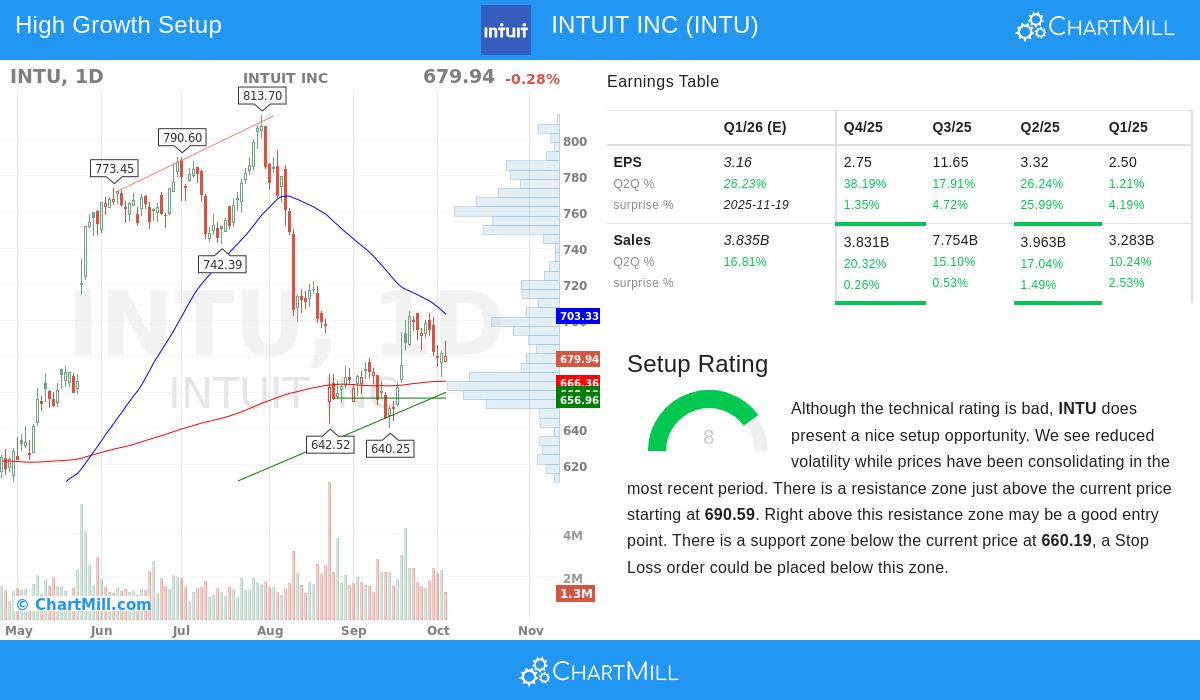
Technical Setup Analysis
While INTU's overall technical rating is now at 2/10 because of recent neutral trends, the setup rating of 8/10 shows a notable consolidation pattern that frequently comes before big moves. The stock has been moving in a set range between $640.25 and $705.08 over the last month, with lower volatility hinting at possible energy gathering for a directional move.
Important technical levels to watch are:
- Resistance zone: $690.59 to $703.33 (mix of trendlines and moving averages)
- Support zone: $656.96 to $660.19 (multiple timeframe trendline meeting point)
- Secondary support: $646.02 (flat level)
The present price near the middle of this consolidation range, paired with the setup rating of 8, indicates the stock could be getting ready for a possible breakout above the resistance zone. This technical pattern is especially interesting given the stock's fundamental strength, as breakouts from consolidation patterns in companies with sound basics often result in continued upward trends.
Integration of Fundamental and Technical Factors
The mix of INTU's good growth traits with its present technical setup forms a notable situation for investors using this method. The fundamental strength gives the basic business quality that supports continued growth, while the technical setup provides a possible timing tool for entry.
The growth investing ideas noted in our opening section stress the value of companies with increasing earnings, good profitability, and financial health, all traits that INTU shows through its fundamental ratings. When these fundamental qualities line up with helpful technical patterns showing lower volatility and clear support and resistance levels, the chance for successful breakout moves might improve.
For investors wanting to look at similar opportunities that mix good growth basics with encouraging technical setups, more screening results can be found using our Strong Growth Stocks with good Technical Setup Ratings screen.
For full fundamental analysis, see the INTU Fundamental Report, and for complete technical analysis, check the INTU Technical Report.
Disclaimer: This article is for informational purposes only and does not constitute investment advice, recommendation, or endorsement of any security. Investors should conduct their own research and consult with a qualified financial advisor before making investment decisions. Past performance is not indicative of future results.