
Despite its impressive fundamentals,INTERNATIONAL SEAWAYS INC (NYSE:INSW) remains undervalued.
By Mill Chart
Last update: May 3, 2025
INTERNATIONAL SEAWAYS INC (NYSE:INSW) was identified as a decent value stock by our stock screener. INSW scores well on profitability, solvency and liquidity. At the same time it seems to be priced very reasonably. We'll explore this a bit deeper below.
Unpacking INSW's Valuation Rating
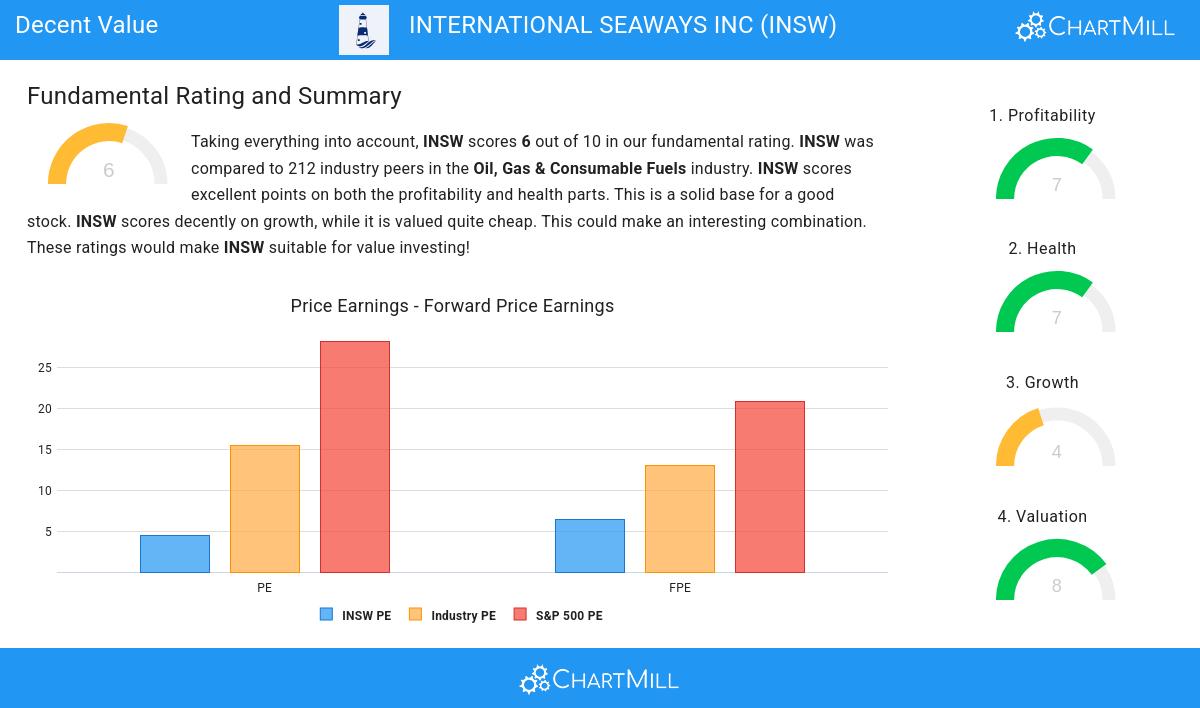
ChartMill assigns a proprietary Valuation Rating to each stock. The score is computed by evaluating various valuation aspects, like price to earnings and free cash flow, both absolutely as relative to the market and industry. INSW was assigned a score of 8 for valuation:
- The Price/Earnings ratio is 4.50, which indicates a rather cheap valuation of INSW.
- Based on the Price/Earnings ratio, INSW is valued cheaply inside the industry as 88.68% of the companies are valued more expensively.
- INSW is valuated cheaply when we compare the Price/Earnings ratio to 28.22, which is the current average of the S&P500 Index.
- The Price/Forward Earnings ratio is 6.47, which indicates a rather cheap valuation of INSW.
- INSW's Price/Forward Earnings ratio is rather cheap when compared to the industry. INSW is cheaper than 83.02% of the companies in the same industry.
- The average S&P500 Price/Forward Earnings ratio is at 20.86. INSW is valued rather cheaply when compared to this.
- INSW's Enterprise Value to EBITDA ratio is a bit cheaper when compared to the industry. INSW is cheaper than 74.53% of the companies in the same industry.
- INSW's Price/Free Cash Flow ratio is rather cheap when compared to the industry. INSW is cheaper than 85.38% of the companies in the same industry.
- The decent profitability rating of INSW may justify a higher PE ratio.
Profitability Assessment of INSW
ChartMill assigns a proprietary Profitability Rating to each stock. The score is computed by evaluating various profitability ratios and margins and ranges from 0 to 10. INSW was assigned a score of 7 for profitability:
- Looking at the Return On Assets, with a value of 15.80%, INSW belongs to the top of the industry, outperforming 90.09% of the companies in the same industry.
- Looking at the Return On Equity, with a value of 22.44%, INSW belongs to the top of the industry, outperforming 83.96% of the companies in the same industry.
- With an excellent Return On Invested Capital value of 13.33%, INSW belongs to the best of the industry, outperforming 85.38% of the companies in the same industry.
- Looking at the Profit Margin, with a value of 43.77%, INSW belongs to the top of the industry, outperforming 91.51% of the companies in the same industry.
- The Operating Margin of INSW (44.42%) is better than 88.68% of its industry peers.
- In the last couple of years the Operating Margin of INSW has grown nicely.
- INSW has a better Gross Margin (67.23%) than 73.58% of its industry peers.
- In the last couple of years the Gross Margin of INSW has grown nicely.
Assessing Health Metrics for INSW
Every stock is evaluated by ChartMill, receiving a Health Rating on a scale of 0 to 10. This assessment considers different health aspects, including liquidity and solvency, both in absolute terms and relative to industry peers. INSW has achieved a 7 out of 10:
- INSW's Altman-Z score of 2.48 is fine compared to the rest of the industry. INSW outperforms 77.36% of its industry peers.
- INSW has a debt to FCF ratio of 2.58. This is a good value and a sign of high solvency as INSW would need 2.58 years to pay back of all of its debts.
- The Debt to FCF ratio of INSW (2.58) is better than 79.25% of its industry peers.
- INSW has a Debt/Equity ratio of 0.34. This is a healthy value indicating a solid balance between debt and equity.
- INSW has a Current Ratio of 2.87. This indicates that INSW is financially healthy and has no problem in meeting its short term obligations.
- The Current ratio of INSW (2.87) is better than 82.55% of its industry peers.
- A Quick Ratio of 2.86 indicates that INSW has no problem at all paying its short term obligations.
- INSW's Quick ratio of 2.86 is amongst the best of the industry. INSW outperforms 84.43% of its industry peers.
Analyzing Growth Metrics
ChartMill employs its own Growth Rating system for all stocks. This score, ranging from 0 to 10, is derived by evaluating different growth factors, such as EPS and revenue growth, taking into account both past performance and future projections. INSW has earned a 4 for growth:
- The Earnings Per Share has been growing by 68.58% on average over the past years. This is a very strong growth
- INSW shows a strong growth in Revenue. Measured over the last years, the Revenue has been growing by 21.05% yearly.
Every day, new Decent Value stocks can be found on ChartMill in our Decent Value screener.
Check the latest full fundamental report of INSW for a complete fundamental analysis.
Disclaimer
Important Note: The content of this article is not intended as trading advice. It is essential to perform your own analysis and exercise caution when making trading decisions. The article presents observations created by automated analysis but does not guarantee any trading or investment outcomes. Always trade responsibly and make independent judgments.
NYSE:INSW (6/27/2025, 9:50:01 AM)
37.64
-0.5 (-1.31%)
Find more stocks in the Stock Screener
