
For investors who use charts and price action to guide their decisions, a methodical process for finding opportunities is important. One technique involves looking for stocks that are both technically sound and forming a positive pattern, preparing for a possible price increase. This method focuses on two main proprietary metrics: the ChartMill Technical Rating, which measures the general condition and direction of a stock, and the ChartMill Setup Quality Rating, which examines if the stock is resting in a way that presents a defined, manageable entry point. By merging these scores, traders try to find breakout formations in leading stocks, looking to enter as a new phase of a confirmed uptrend starts.
A recent search using this method has identified CF Industries Holdings Inc. (NYSE:CF) as a candidate deserving further examination. The nitrogen fertilizer producer currently has a sound technical profile combined with a favorable consolidation pattern, indicating it may be ready for its next upward move.
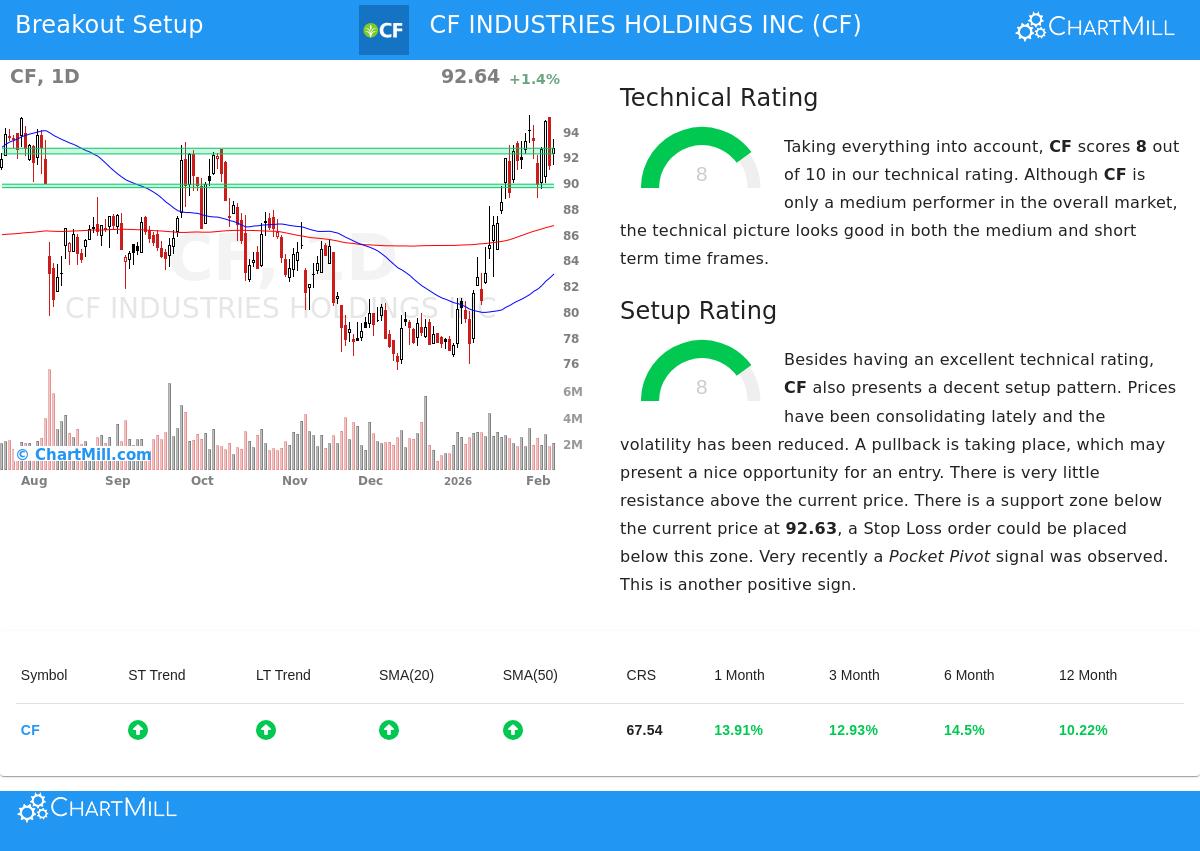
Examining the Technical Strength
The base of this method is a stock's fundamental technical condition, measured by the ChartMill Technical Rating. A high score shows a sustained uptrend across several time periods, which is important because trading with the main trend improves the chance of success. CF Industries receives a good score of 8 out of 10, denoting a technically healthy stock in a definite uptrend.
A closer look at the full technical report shows the elements supporting this score:
- Trend Agreement: Both the near-term and longer-term trends for CF are marked as positive. This agreement across time periods is a significant bullish sign, showing steady buying interest.
- Moving Average Backing: The stock's price is above all its important simple moving averages (20, 50, 100, and 200-day), and each average is also in a rising formation. This layered, rising support formation is a typical sign of a sound uptrend.
- Sound Relative Performance: While the wider S&P 500 index is in a positive near-term trend, CF is maintaining its position. The report states it performs better than 67% of all stocks over the last year, showing market-relative strength that is necessary for leadership.
This mix of factors means CF is not just moving higher by chance; it is doing so with the kind of steady, momentum-supported traits that technical investors look for in a leading stock.
Examining the Setup Quality
A sound trend by itself is not a buy signal. Entering a stock that has already made a big, prolonged move often results in buying at a high. This is where the Setup Quality Rating becomes important. It finds periods of consolidation or narrow trading areas inside an uptrend, which can offer a more manageable entry point before a possible breakout. CF's Setup Rating of 8 indicates it is in such a positive stage.
The technical report explains why the setup looks favorable:
- Consolidation Inside a Range: Over the last month, CF has traded between about $80.48 and $95.21. It is currently testing the top limit of this range. This time of pause after a previous rise has let the stock absorb its gains and form a new base of support.
- Defined Support and Risk Control: The analysis notes a clear support area between $92.19 and $92.63, just under the current price. For a trader, this gives a sensible and close level to set a protective stop-loss order, clearly stating the risk of the trade if the breakout does not succeed.
- Positive Volume Indicator: Recently, a "Pocket Pivot" signal was seen, a formation where the stock rises on volume larger than any down-volume day in the earlier period. This can be an early indicator of institutional buying during a consolidation, adding a degree of confirmation to the setup.
A Possible Trading Plan
Based on this examination, the report describes a sample, automated trading idea. It proposes a possible entry on a breakout above the recent range high at $95.22, with a stop-loss set under the noted support area at $92.18. This states a risk of about 3.2% on the trade. It is important to know this is a mechanical example created from the formation; individual investors should modify such details to match their own risk preference and trading strategy, and always know about upcoming company events like earnings reports.
Find More Possible Breakout Formations The market is active, and new formations appear regularly. The search that found CF is performed often to filter for stocks showing both high technical and setup scores. You can see the current list of qualifying stocks by going to the Technical Breakout Setups screen.
,
Disclaimer: This article is for informational purposes only and does not constitute investment advice, a recommendation, or an offer or solicitation to buy or sell any securities. The examination presented is based on technical metrics and should not be the only basis for any investment decision. All trading involves risk, including the possible loss of principal. You should do your own research and talk with a qualified financial advisor before making any investment decisions.