
For investors looking to build a portfolio aimed at producing passive income, a disciplined selection process is necessary. One useful approach includes searching for companies that provide an appealing dividend now and also have the fundamental financial soundness to maintain and possibly increase those payments in the future. This tactic frequently seeks stocks with a strong total dividend score, which assesses yield, growth, and consistency, while also demanding a foundation of adequate profitability and financial soundness. This pairing tries to find dependable distributors that are not risking their future security for a high present yield.
Best Buy Co Inc (NYSE:BBY), the consumer electronics retail leader, appears as a selection from this kind of process. The company’s basic profile makes a strong case for dividend-oriented investors, especially those who seek a mix of income, value, and acceptable business steadiness.
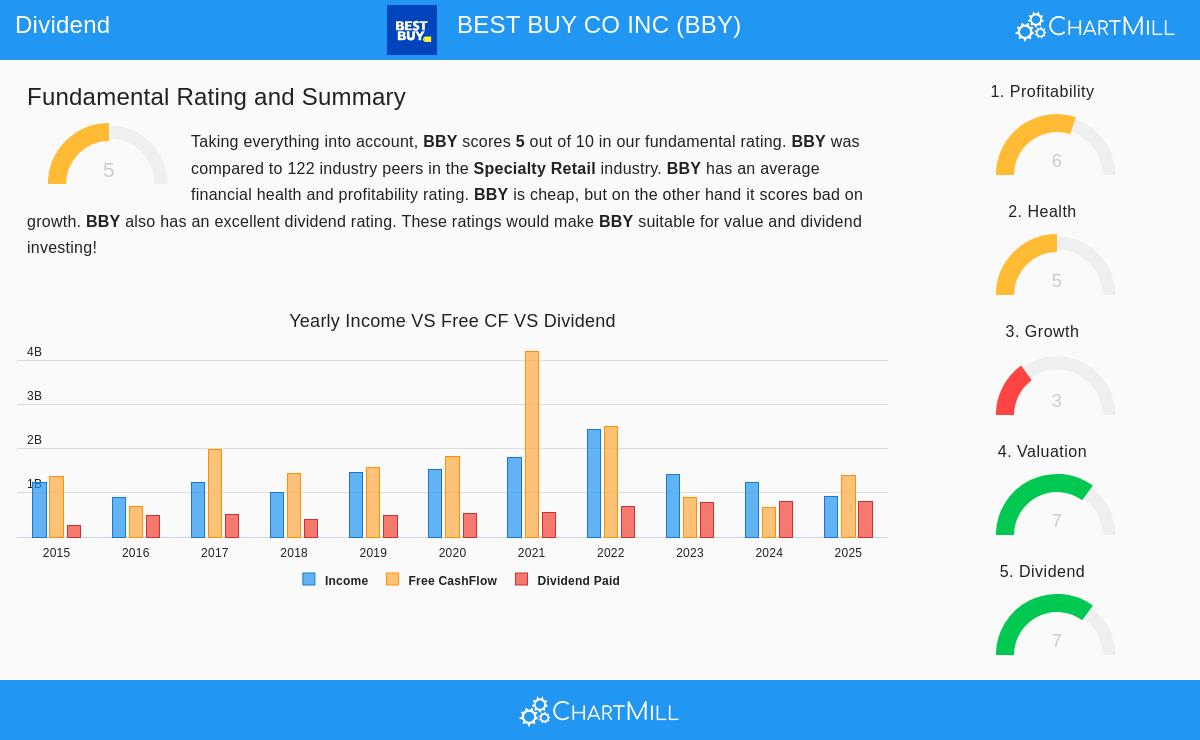
Dividend Attraction: A High Yield with History
The central point of BBY's attraction for income investors is its dividend outline, which receives a firm 7 out of 10 on ChartMill’s Dividend Rating. This score combines a number of important elements that dividend approaches examine.
- Appealing Current Yield: Best Buy provides a yearly dividend yield near 5.07%. This is over twice the average yield of the S&P 500 and places it in the higher range of its specialty retail industry group.
- Steady and Increasing Payment: The company has built a consistent history, having distributed and not cut its dividend for at least ten years. Also, it has raised its dividend at a notable yearly rate of over 13% during this time, showing a dedication to giving more capital back to shareholders.
- A Point on Consistency: While the yield and growth story are solid, a closer examination shows a reason for care. The company's payout ratio—the part of profits paid as dividends—is now over 124%. This means recent dividends have used more than just current profits, which is not a maintainable long-term method. This points out the key reason why checking for profitability and soundness is important; it confirms the company has the financial ability to later match its payment with maintainable profits.
Supporting Basics: Profitability and Financial Soundness
A high dividend is only as reliable as the company’s capability to keep it. This is where the selection rules for "adequate profitability and soundness" give important background for BBY’s dividend narrative.
Profitability (Rating: 6/10): Best Buy keeps acceptable profitability measures that back its activities. Its Return on Equity (24.31%) and Return on Invested Capital (19.29%) are especially good, doing better than most industry rivals. This shows efficient use of shareholder capital. Still, margins face pressure, with both Profit Margin and Operating Margin having fallen lately. The selection filter makes sure we skip companies with poor or worsening profitability, which could directly endanger future dividend payments.
Financial Soundness (Rating: 5/10): The company’s financial soundness shows a varied but acceptable view. On the good side, BBY displays solid solvency. Its debt amounts are fair compared to equity, and its low Debt-to-Free-Cash-Flow ratio implies it could settle all its debt soon with its present cash flow production—a mark of financial firmness. The main worry is in liquidity, with Quick and Current ratios that are below standard for the industry. This points out the value of the soundness filter; it warns investors to possible near-term financial limits, even if the long-term solvency view is steady.
Valuation and Growth Setting
From a valuation view, BBY seems low-priced. Its Price-to-Earnings ratio of 11.57 and Forward P/E of 10.91 are much under both the wider market and the industry average. This valuation implies the market has limited growth hopes, which matches the company’s recent results. BBY’s growth rating is a weak 3/10, with revenue and profits having been unchanged to somewhat negative over recent years. However, analysts forecast a move back to small growth in both sales and earnings per share in the next years. For a dividend investor, this low price can give a safety buffer and add to the stock’s total return possibility if the growth view gets better.
Summary
Best Buy stands as a possible selection for dividend investors using a tactic mixing yield with basic protections. The stock gives a high, long-standing yield with a history of growth, backed by adequate total profitability and firm long-term solvency. The selection process correctly marks both its positive points—the appealing dividend and good returns on capital—and its main tests, specifically the inconsistent payout ratio and limited liquidity. These elements are necessary for investors to consider.
This review shows why a multi-factor screen is helpful: it finds income possibilities while automatically noting parts that need more investigation. The high dividend score brings notice, and the related profitability and soundness scores supply the needed structure to judge the payment’s staying power.
For a complete look at the basic elements behind these scores, you can see the full ChartMill Fundamental Analysis Report for BBY.
Investors wanting to find other companies that meet similar rules for dividend steadiness, profitability, and financial soundness can check the preset screen Best Dividend Stocks.
Disclaimer: This article is for informational purposes only and does not constitute financial advice, a recommendation, or an offer or solicitation to buy or sell any securities. The information presented is based on data provided and should not be the sole basis for any investment decision. Investors should conduct their own independent research and consult with a qualified financial advisor before making any investment.