

AMGEN is a biotechnology company, which engages in the discovery, development, manufacture and marketing of human therapeutics. The company is headquartered in Thousand Oaks, California and currently employs 24,200 full-time employees. The firm discovers, develops, manufactures and delivers various human therapeutics.
AMGN released its first quarter 2022 results in late April and the results were slightly better than expected. Higher volumes provided a much-needed counterbalance to lower prices. The revenue forecast for 2022 is a bit disappointing but on the other hand, average revenue growth through 2030 is estimated at 5% with earnings growth of 8 to 12%.
The full quarterly report can be accessed on AMGEN's website.
FINANCIALS full report here
Profitability
- AMGN has a Return On Assets of 9.67% (outperforming 90% of its industry peers) and a Profit Margin of 21.75% (outperforming 88%). These are amongst the best returns in the industry.
Valuation
- The Price/Earnings Ratio is 14.01 with a Forward Price/Earnings Ratio of 12.74. These are correct valuations which are in line with the industry average at 13.03.
- When comparing the Enterprise Value to EBITDA ratio to the average industry ratio, AMGN is valued more expensive than its industry peers, 93% of the companies listed in the same industry are valued cheaper.
Growth
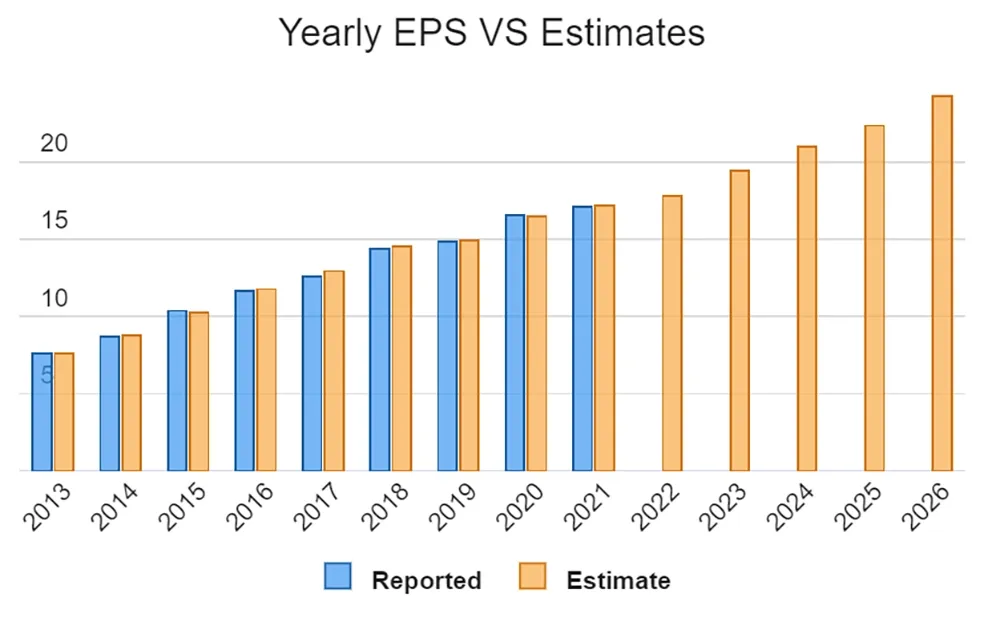
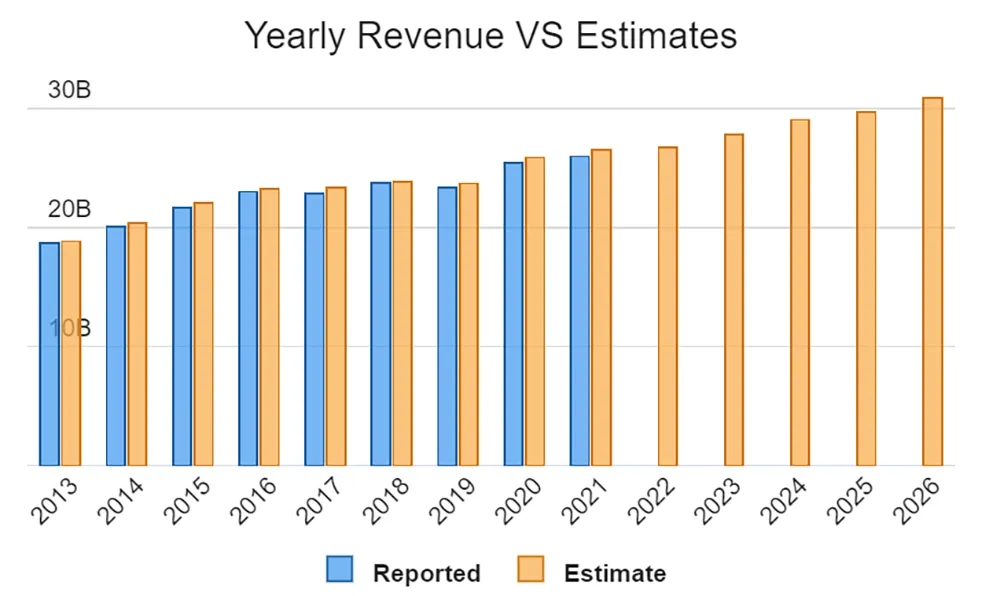
- The Revenue growth is accelerating: in the next 5 years the growth will be better than in the last years.
- Based on estimates for the next 5 years, AMGN will show a small growth in Earnings Per Share. The EPS will grow by 7.28% on average per year.
- The Revenue is expected to grow by 3.11% on average over the next 5 years.
Financial Health
- A Current Ratio of 1.44 indicates that AMGN should not have too much problems paying its short term obligations.
- AMGN has a Quick Ratio of 1.09. This is a normal value and indicates that AMGN is financially healthy and should not expect problems in meeting its short term obligations.
- AMGN has one of the worst Debt to Equity ratios in its industry. 100% of its industry peers require less debt for financing their operations.
- The Altman-Z score is in line with the industry averages, which is at 1.02.
Dividend
- Compared to an average S&P500 Dividend Yield of 2.18, AMGN pays a bit more dividend than the S&P500 average.
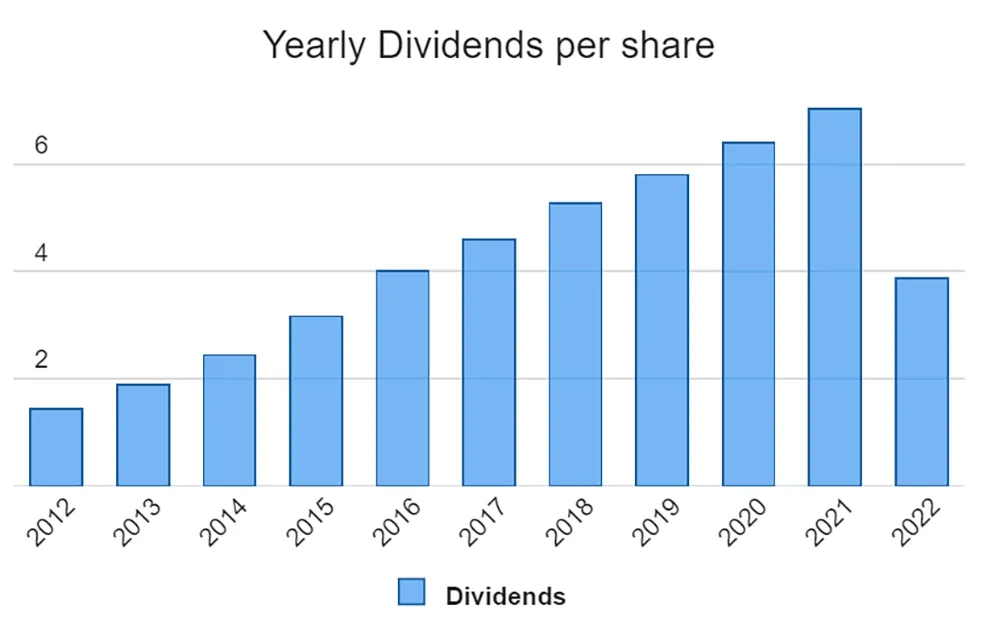
- The dividend of AMGN is nicely growing with an annual growth rate of 10.06%!
- AMGN has paid a dividend for at least 10 years, which is a reliable track record.
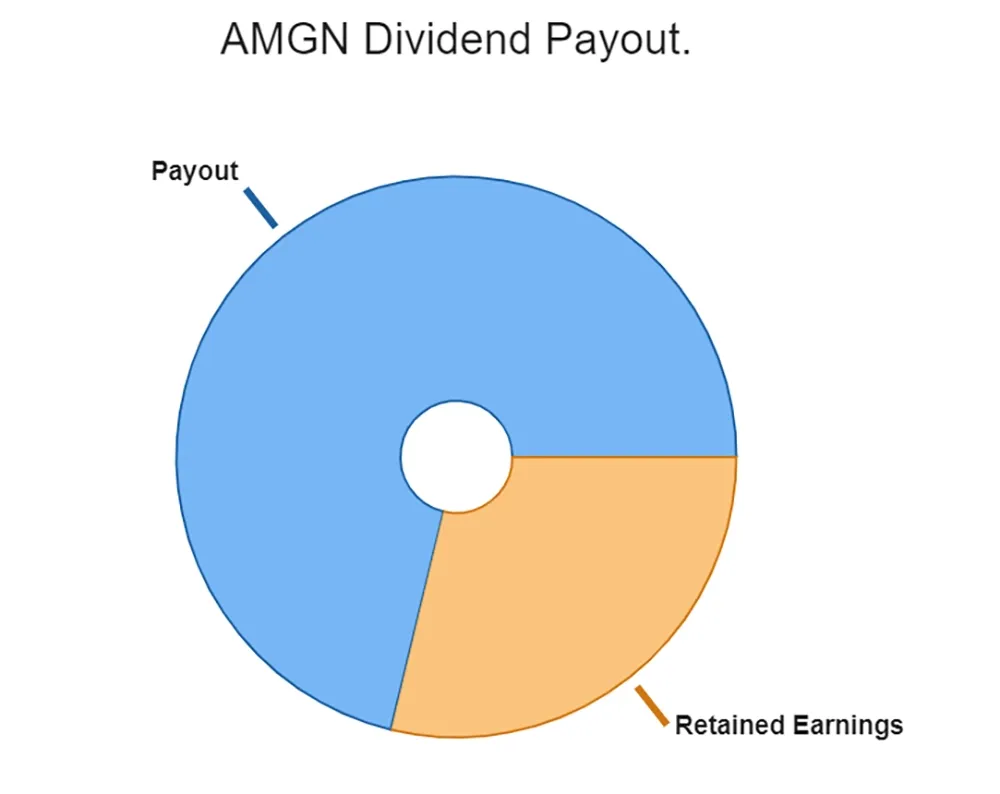
- 71.24% of the earnings are spent on dividend by AMGN. This is a high payout ratio that may be difficult to sustain over the long term.
TECHNICALS full report here
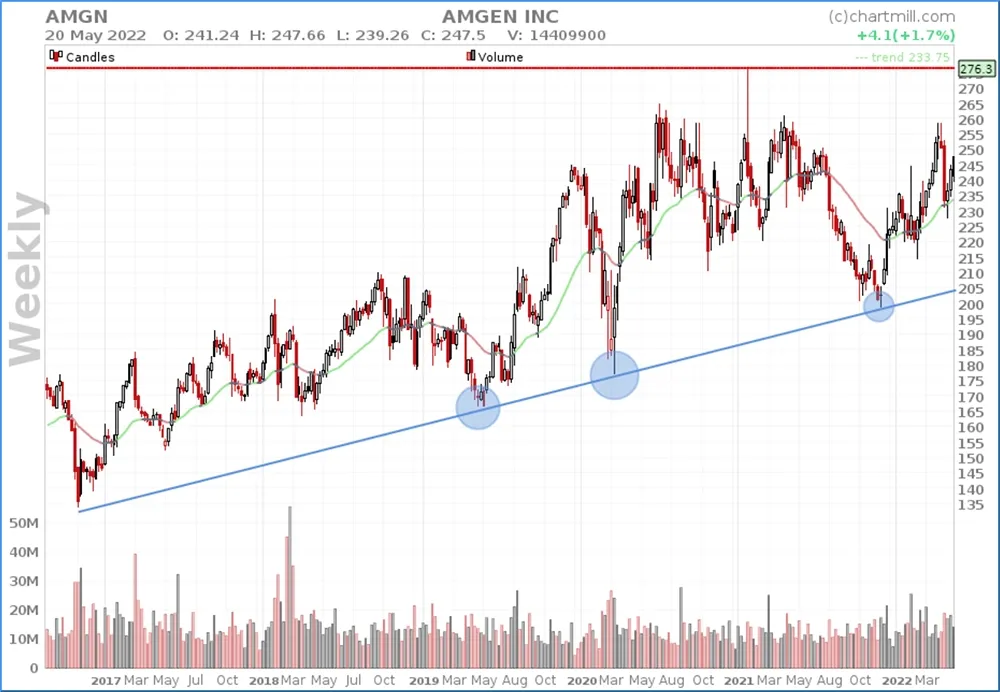
Weekly chart
In late November, the price tested the existing long-term support at the level of the blue rising trend line for the 4th consecutive time. Since then the price has risen with a current intermediate top just below the $260-level. The current price level is trading roughly in the middle of the long-term ascending triangle (formed by the blue and red line). Together with the green colored ChartMill Trend Indicator, the long-term trend remains positive for the time being.
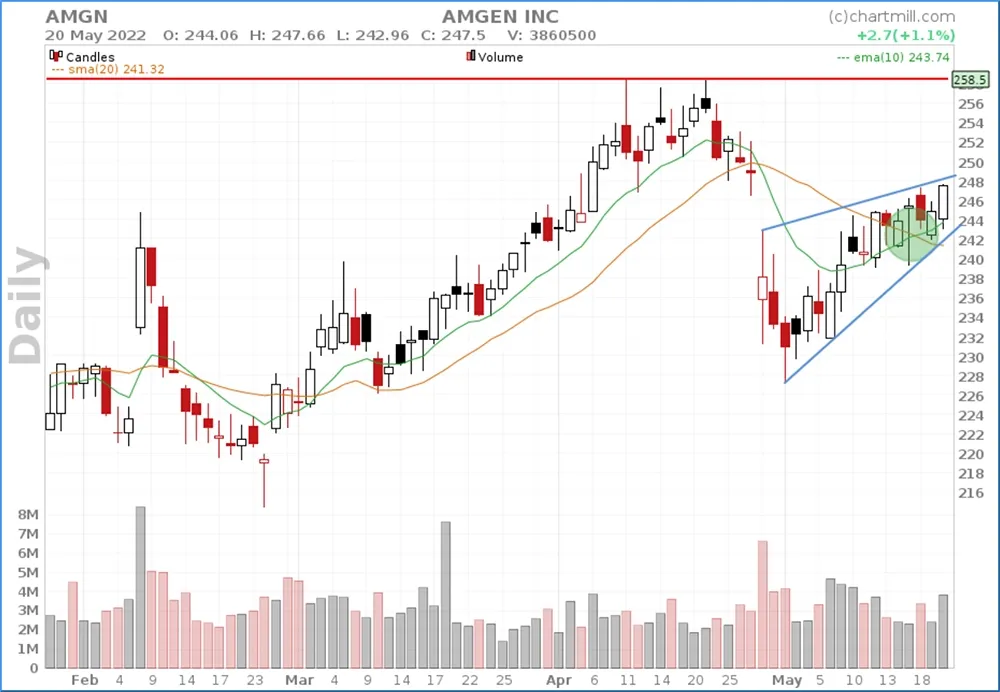
Daily chart
Last week, the EMA10 crossed the SMA20 upwards, bringing the short-term trend back to positive. On the daily chart one can recognize a wedge pattern. An upward breakout offers opportunities towards the existing high at $258.5. If the price breaks through the wedge downwards, there is initially room to around $228.
SUMMARIZED
The solid growth prospects and the very stable dividend policy ensure that this company, with a market-based P/E ratio of 14, remains an attractive stock for those looking for quality in the biotech industry. The fact that the company appears to be buying back its own shares at a considerable pace is a nice bonus.
Both the long-term and short-term technical trends are positive, which in the current challenging market conditions is surely a sign of strength that should not be underestimated.
ChartMill.com
![]()
![]()
*This content is for informational purposes only, you should not construe this information or other material in any sense as legal, tax, investment, financial or other advice. Please read our full Disclaimer.