
TRADERS - Portfolio metrics
Published on Chartmill with kind permission of TRADERS’ Magazine. Check the original PDF article here
Trading and investing are done with one major purpose in mind: making profits. Even though preventing losses are part of the package as well, one’s returns seem to be the ultimate (dis)proof of one’s ability. In this article we are going to take a shot at convincing you of why looking at returns is a very bad idea when it comes to estimating one’s long term potential in fi nancial markets. And of course, we will end up suggesting what better indicators there might be.
"We see way too many patterns and causal relationships."
Making it alive running through a dynamite factory with a burning match in your hand doesn’t mean you are not an idiot. More accurately, it doesn’t mean deciding to do so was a good idea to begin with. Welcome to our biased world.
The Third Monkey
As evolutionary biologists well know by now, we are a species (not the only one) of overactive pattern seekers. During our evolution, this started out with physical patterns but quickly turned into looking for causal relationships as well. All of this is good, because it has put us where we are today. The sons and daughters of a very impressive chain of survivors harnessing those powers along the way. However, falsely recognising something that isn’t there, doesn’t diminish our survival chances.
Not seeing what actually is there, almost guarantees not handing over genetic material to the next generation. So up until today, we see way too many patterns and causal relationships.
Biases in Abundance
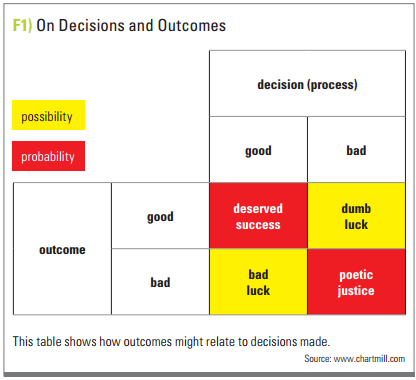
The relationship relevant in the search for where our obsession with returns comes from, is the one between the decisions we make (process) and the outcomes we eventually get. To most it is crystal clear that with good decisions must come good results. And while affirming the antecedent we wrongly turn this upside down into good results having to be proof of good decisions made. Unfortunately there is a lot wrong with this default view.
Figure 1 shows that with good and bad decisions on one side and good and bad outcomes on another, there are four, not two, possible combinations. So on any individual occasion, good decisions may unfortunately turn into bad outcomes while good outcomes may spring from even bad decisions. That is what we call bad luck in the former case and dumb luck in the latter. For an individual occasion we are talking (four) possibilities, but in a repetitive frame, sticking to good decisions will on average have good results as output. That is probability taking over. Having four possibilities doesn’t mean they will share equal likelihood (25 per cent).
Judging decisions on their outcome, although not all that is known now was known at the time the decision had to be made, is what is called outcome bias. Its close friend, hindsight bias, states that we are prone to estimate what we knew or how we felt making the decision. The ”I knew effect”. Well, you probably didn’t know it then!
While similar to the outcome bias, the two phenomena are markedly different. The hindsight bias focuses on memory distortion to favour the actor, while the outcome bias focuses exclusively on weighting the past outcome heavier than other pieces of information in deciding, if a past decision was a good one.
A colleague once tried to convince me of the fact that it seemed obviously a good idea, at least to him, having bought shares of a tumbling bank in 2008 a week before breaking news. Having made a whopping 200% out of it, he was all confused and surprised by my question if it also seemed a good idea at the moment he made the decision.
Mind the fact that good decisions are not restricted to knowing what stock to buy. There’s are far more important decision a good trader can make, in the absence of knowing what the outcome will be. Selling losers before a mistake turns into a problem is just one of them.
Profit (De)bunk(ing)
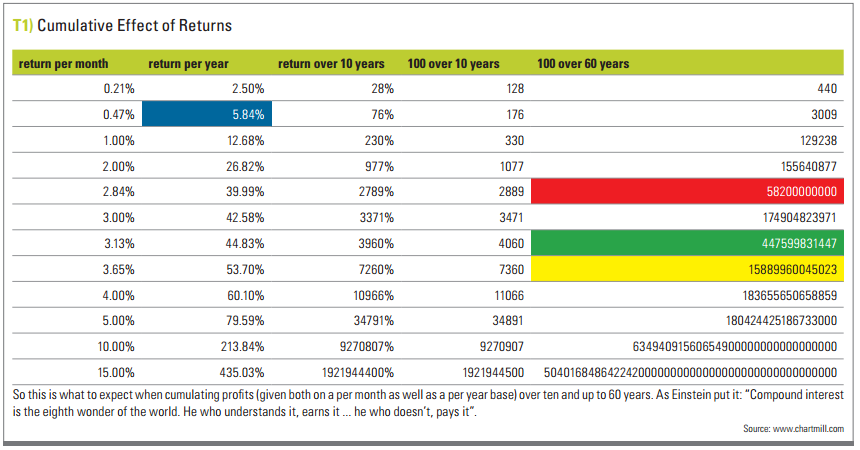
No shortage of fisherman’s yarn in the financial industry. One way to defuse the excessive importance we put on returns (after all the good outcome we are looking for), is to put them in perspective on a larger time scale. We present you figure 2, a table of long term compound returns. In blue, we have the average risk free return over the past 53 years. In red Buffett’s net worth is shown, while in green and yellow we have the GDP of Belgium (a small country) and the USA (a very large country).
Now that should put in perspective, a few of the examples of great returns. For instance on the lowest row we have the winner of a one-month guru competition. Simple math indicates that these examples are highly probable just plain luck (or fraud) and very likely impossible to be even an average sustainable return. Another one is a service stating it’s easy to achieve a 200 bucks earning a day on a 10K portfolio. Of course you can’t compound or this would make too much money, we were told criticizing this scam with the same numbers of figure 2.
Repetitiveness and scalability are key in turning your traders’ mind around such examples. If something sounds too beautiful to be true, it probably is. If they promise you quick wealth, quick is how you need to get out.
New Quality Metrics
If returns are not the way to measure achievement, then what is? Well, in true science we have to keep track of the misses, not just the hits! Likewise a good trader is to be spot by looking at his losses.
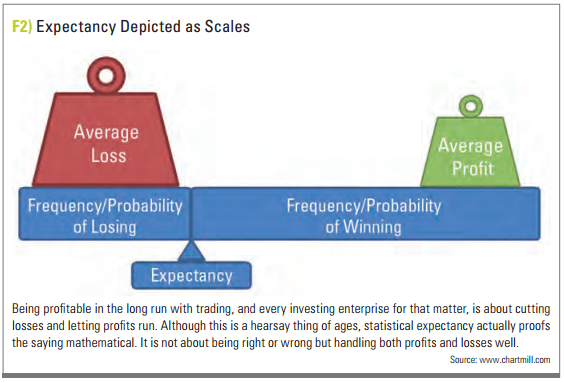
Take figure 3. A picture we frequently (re)use to explain that profits come from balancing the average size of profits and losses over their relative frequency. Since we have far more control over the average size of our profits and losses than we have over their frequency, we should focus on minimizing losses and maximizing gains. From this it follows that a good portfolio or trader must be recognizable from an overall historical picture showing (lots of) small losses and (probably fewer) big winners. In contrast though, with each momentarily look at such a portfolio, chances are that you’ll find just the opposite. For there will be few small losses and almost only (big) winners. Because losses need to be weeded out quickly. So metrics might include the average size of losers against the average size of winners but also the average holding period of losers against that of winners. Also having a rising equity curve with small drawdowns and more losers than winners is a strong indication of a good trader.
One remarkable psychological study even showed how long term performance of traders was, to a certain extent, inversely correlated with how frequently performance was measured (by return). So the more traders look at their returns, the less they seem to have them. But we cannot deduce any causality from this without further study. It could just as well be that bad traders look at their returns more. But even then it’s a correlative indicator, nevertheless.
In Conclusion
Returns, in the end, will be the result of being a consistent trader focusing on self-reflection while keeping a constant eye on risk management and position sizing. So as bad a metric returns are on short time scales, as inevitable they will be in the long run as the ultimate proof of being able to do the right things instead of doing things right.
Dirk Vandycke has been actively and independently dirk@monest.net studying the markets since 1995 with a focus on technical analysis, market dynamics and behavioural finance. He writes articles on a regular basis and develops software partly available at his co-owned website www.chartmill.com. He teaches software development and statistics at a Belgian University.