
TRADERS - Chartmill website review
Published on Chartmill with kind permission of TRADERS’ Magazine. Warning: the information in this article can be outdated. Check the original PDF article here
The website www.chartmill.com is a Technical Analysis website created by traders for traders. Its main features are charting applications, a stock screener and a sector analysis tool. Chartmill supports most of the classical technical analysis indicators along with some state-of –the–art indicators and concepts like Pocket Pivots, Effective Volume, Relative Strength and Anchored VWAPs (MIDAS curves).
First, we'll discuss some of these concepts. After that, we'll have a look at the screener and charting applications.
Relative Strength
Relative Strength is available in different forms at chartmill.com. Two relative strength related indicators are available in the charts and screener:
- Mansfield Relative Strength: this compares the performance of the stock to the S&P500 index. This form of relative strength is mostly known from Stan Weinsteins Classic “Secrets for Profiting in Bull and Bear Markets'.
- Dorsey Relative Strength: this indicator also compares the performance of the stock to the S&P500, but in a slightly different manner. This form of Relative Strength was used in “Point and Figure Charting” by Thomas Dorsey.
This latter form is highly usefull in the screener where one can filter stocks based on their ranking number.
Strong Stocks
The screener supports the concept of 'strong stocks', which are stocks with a high relative strength. But there’s more. Not all stocks with a high relative strength ranking are also 'strong stocks'. Relative strength looks at the performance over the past year. Some stocks just made a huge jump at some point because of a fundamental event. This jump gives them a high relative strength value. However, one is not interested in those stocks, but in stocks that show a nice and steady trend over the year, not stocks that are flat, jump 300% higher and then flatten out again. Strong Stocks filters the nicest steady trends in the market and does a terrific job in mimicking IBD stock lists.
Effective Volume
Effective Volume is an indicator that was introduced in the book 'Value In Time' by Pascal Willain. The indicator looks at the intraday minute data to find out what large players are doing in a certain stock. It is able to discover accumulation or distribution by large players in the analyzed stock.
Effective Volume is used in several ways on chartmill.com:
- To analyze accumulation and distribution in individual stocks in the charting applications.
- To filter stocks under heavy accumulation or distribution by large players in the screener. Especially those situations where a divergence between accumulation or distribution is measured against the performance of the stock, are of interest.
- To measure the accumulation or distribution of all stocks in a certain sector or industry. This gives us a nice market breadth indicator.
More not so common indicators
The charts and screener support some other indicators that are not commonly found in other charting applications:
- Support and Resistance: support and resistance trend lines will automatically be drawn on the chart when this indicator is selected. Also the screener allows screening for stocks near their trend lines or about to break them.
- Chartmill Channels: a proprietary indicator developed by Dirk Vandycke. Chartmill channels draw a horizontal channel that is optimized for both width and length: The Chartmill Channel determines the longest and narrowest channel possible on a chart. This is very useful for finding stocks that trade in a channel, like for instance required for Weinstein and CANSLIM setups.
- Chartmill Value Indicator: another indicator by Dirk Vandycke that determines whether a stock is cheap or expensive within its short term context. Contrasting most other oscillators it hasn’t got lag or stickiness in overbought/oversold zones while a trend marches on.
- Pocket pivots: pocket pivots were recently introduced by Chris Kacher & Gil Morales in their book “Trade Like an O’Neil Disciple”. They basically find moves under high volume in stocks. The screener supports screening for stocks that had one or more pocket pivot recently.
Stock Screener
The most impressive feature of www.chartmill.com is definitely the stock screener. The concepts listed above are all supported by the screener. Figure 1 shows a screenshot of the screener.
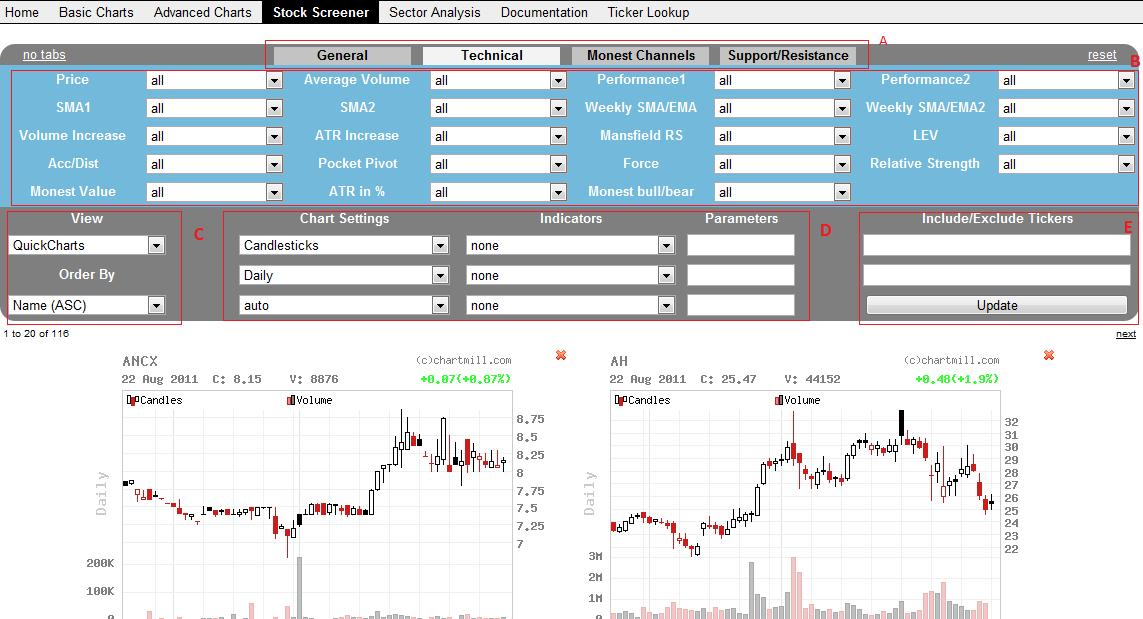
The screener has a number of tabs ( marked 'A' in screenshot ) that group a set of settings ( 'B' in the screenshot). There is:
- A General tab. Here general filters such as the market, sector or industry can be applied. A very interesting field on this tab is 'signal'. 'Signal' has a list of signals that are very useful starting points. Examples are: 'near new high', 'strong stocks' or 'pocket pivot today'.
- The Technical tab allows for lots of technical filters like price performance, relative strength, accumulation or distribution and many other technical indicators.
- The 'Monest Channels' tab allows filtering based on the properties of the Monest Channels. Here one can filter on the width or length of the channel, but also the 'strength' which is the number of times it was visited by the price in the past. The strength of a channel also determines how strongly the channel acts as support or resistance.
- The 'Support and Resistance' tab allows filtering based on the properties of the support & resistance lines on the chart. This allows you to search for stocks that are near important support or resistance levels.
- 'view' allows you to select between a table, quick charts, a detailed technical view or a CSV based ticker list.
- 'order by' allows for sorting results. You can for instance sort by 3 month performance , relative strength, or one of many other sorting options.
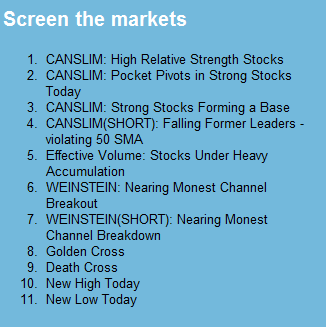
Screening Shortcuts
The chartmill.com homepage offers an easy entry to the screener and contains some handy shortcuts to get started. Traders can start from the shortcut and can then further refine the filters based on their needs. Figure 2 shows these shortcuts.
Charting
Chartmill.com has 2 charting modules: the Basic Charts and the Advanced Charts. Both allow charts in different formats and timeframes with technical indicators and user annotation.
A nice feature of both basic and advanced charts is that you can view multiple charts at a time. If you enter a comma separated list of tickers, all your charts will be shown.
The Advanced charts are more interactive. The advanced charts allow right-clicking on the chart to add anchored indicators on a certain candle. Examples of anchored indicators are stops or vwap’s and will be explained in a minute. Another nice feature of the advanced charts is the position sizing tool, which will also be explained next.
Position Sizing Tool
As every trader should know, the most important aspect of trading is position sizing: you determine where you get out if the trade fails and based on your entry and exit you can determine how many shares you can buy given your account size and the risk you allow for this trade. The position sizing tool does these calculations for you.
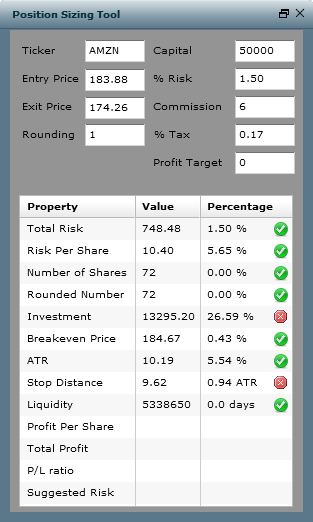
The picture above shows the position sizing tool. It shows a trade on AMZN. The desired entry and exit are filled in, which can be done by right-clicking a chart at the desired entry en exit level. The tool requires the available capital and the % risk one wants to take for the trade. With these numbers filled in, the results are shown in the tool.
In the example, the tool calculates that 72 shares can be bought. If the trades is stopped out, the trader will lose 1,5% of his account or 748.48 dollar. Note that the tool also warns that the total investment is rather big ( over 25% of total port size ) and that the stop is positioned at less than 1 ATR from the entry price, which is too close.
Anchored VWAPS and Stops
An input to for instance an ATR-stop on a chart is the day of the entry. The stop should calculate the maximum price from that day onwards and should subtract n times the ATR value from that. The starting point is called the 'anchor point'.
Anchored VWAPS and Stops are supported by both charting applications, but the advanced charts allow you to interactively select the candle where the VWAP or Stop should be anchored, i.e. calculated from.
Sector Analysis
The site also has a sector analysis tool which allows sorting sectors and industries based on their recent performance, the average accumulation or distribution, the number of new highs, the amount of pocket pivots or many more sector properties.
When a certain sector is found interesting, clicking it opens the screener with the individual stocks from the selected sector.
Feedback
Finally, chartmill.com also listens to traders and its homepage contains a feedback form. All feedback and suggestions are welcome and are taken into account.