TRADERS - Chartmill (fka Monest) Channels
Published on Chartmill with kind permission of TRADERS' Magazine.
Warning: the information in this article can be outdated.
Check Full PDF Article here
Channels are at the heart and soul of technical analysis, from as early as its conception. However, up to this day, they come with a lot of subjectivity. This implies that it’s hard to implement them algorithmically. Yet, computers and automation might have been the single most important driver in the wide spread adoption of the technical analysis discipline. This article will show how to objectify and optimize the calculation of horizontal channels and, hence, the support and resistance lines they’re made up of.
Ranges rock
Ranges are quite important in the analysis of charts and the automation of it. They give birth to the timecompression needed for new trends to develop and for existing trends to turn. Even the most well known systems like William O’Neil’s CANSLIM approach, Weinstein’s stage analysis and a lot of trend following strategies depend on them to make decisions concerning the possible start of a trend, phase or stage. Consolidation, also known as a base, from where an existing trend continues its run, is another example where ranges emerge.
The detection of ranges is where horizontal channels come into the picture. One of the oldest and perhaps most popular ways of describing horizontal channels is by using the definition provided to us by Richard Davoud Donchian (†).
Donchian Channels
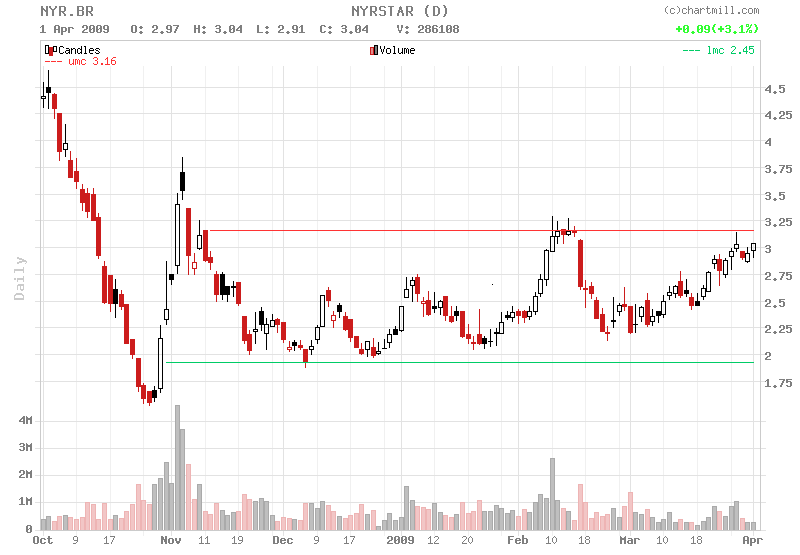
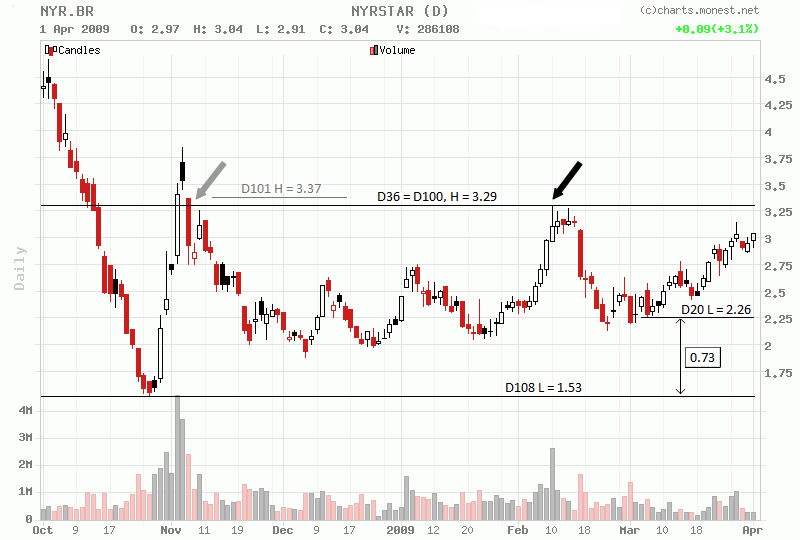
Perhaps Donchian’s channels, named after himself, are even better known as an x-bar high/low. But they’re merely the implementation of the mathematical minimum (min) and maximum (max) functions. What these channels stand for, is basically the looking back over a certain period and calculate the lowest low in this interval, for a support line, or the highest high for a resistance line. Figure 1 shows an upper Donchian channel line (resistance) with a look back period of 36 days and a lower Donchian channel line (support) with a window of 20 days. When you go back in time, starting at the right side of the chart, the highest high over the past 36 days was 3.29, while the lowest low over the past 20 days was 2.26. These lines are annotated on the chart as D36 and D20.
Perhaps, by now, you already noticed the fact that the most recent bar isn’t included to calculate the highest high or the lowest low, because that would mean that our channel lines never could be violated, as, for instance, a higher high for the current bar than the highest high over the look back period, would implicate that our current high would be the upper Donchian channel, by definition. Idem ditto for lower Donchian channel lines.
Furthermore, one could redefine Donchian lines using the close. Our D20 from the example, by this definition, would then become the lowest close over de past 20 bars, while our D36 would stand for the highest close over the past 36 days.
There’s really not much to all this. In fact, Donchian channels are so simple, one might think there’s nothing to add at this point. These channels should do be able to help us detect horizontal channels in an fully automated way. But they don’t.
Not so fast
The truth is, there’s a lot of subjectivity left with Donchian channels, as with many indicators in technical analysis. The question hereby arises what the look-back-period should be. Do we take a 50 bar high or a 60 bar high? Answering this question based on back test results, imposes the danger of curve-fitting on your system.
Secondly, they’re static, meaning they don’t account for any context adaption, such as absolute versus relative prices or, to a lesser degree, volatility. A channel that’s $10 in width in a $10 stock has not the same importance as the same $10 channel in an $100 stock. Even if you would think about expressing channel-width in percentage to stock price, this wouldn’t account for volatility. Defining width in terms of volatility (like ATR units) would be far better. Still, the issue about adaptivity and subjectivity stands, because of the look back period that has to be chosen arbitrarily and up front. So which look back period would you choose?
Chartmill Channels
Meet Chartmill Channels, relieving us from the disadvantages of Donchian Channels. As you will see they are totally objective in both their definition and their implementation, since they don’t need any parameters and they adapt themselves to the context of price, time and volatility.
What are they all about? Looking at figure 1 again, you can see that D36 is the same line as D100. What this means is that our highest high over the past 36 days, happens to be the same highest high over the past 37 days. But also the same highest high over the past 38 days. In fact, we have to go back, up to a 100 days, before we find yet a new higher high. So if we would have arbitrarily chosen a look back period of 36 or higher but anywhere less than 100, we wouldn’t have optimal usage of our channels when interpreting them without a chart. For a 36 day look back period we could have gotten an extra 64 days in length, without widening the channels.
So let’s go over this again for a moment as we outline a few important thoughts. First of all, we need to stop focusing merely on the look back window of Donchian Channel lines, which only accounts for the horizontal dimension. Instead we should calculate the largest possible Donchian Channel line in length for a given price, price representing the vertical dimension. We need to stop thinking of horizontal channels as having only one dimension, as we probably get tricked into this exactly because of the horizontal nature of the separate channel lines. A horizontal line may not have a height in itself, it sure has a vertical coordinate on a chart, which makes for a width of the channel as the difference between the heights of both channel lines the channel is made up of.
Secondly there are opposing forces at work, since the wider we make a channel, i.e. the range of historical prices it captures, the longer its channel lines will get. Look at it this way; if you expand the lines enough, eventually all historical prices will lie between them. Length and width of any channel are, as a matter of fact, functional interdependent of each other. Length is inversely reciprocal to width.
Of course for a channel to be useful it can’t be too wide. On the other hand the longer it gets the stronger a breakout signal may be. A too wide a channel might not be as useful, since price already moved substantially before reaching one of the channel lines, giving late warning to any outbreak. A too short a channel isn’t meaningful as the longer a channel gets the more people come to recognize it and use it and thus the more meaningful it becomes as an analysis instrument. So, how can we have both maximum length and minimum width, or, as that’s not possible, a optimal trade-off?
Implementation
The answer to this question is given to us by classic high school math to solve max/min problems through the use of derivatives. There’s one problem though, we don’t know the function describing a price chart and, as a consequence, neither do we know the functional description of the relationship between width and height of any channels. We’ll probably never know. Luckily, there’s a simple trick to circumvent this problem as we can use discrete derivatives. Now, don’t you stop reading. This sounds a lot more complex than it really is.
The first derivative of a function gives us the speed at which that function is ascending or descending. Translated to our price charts, this simply means we are going to look at how much longer the maximum Donchian Channels line gets as we increase its height by the smallest increment possible (i.e. a tick – being most often one cent). So to calculate the upper Chartmill Channel line we start by measuring the length that prices stay beneath one cent above our most recent close. Next we calculate the same length for a price one cent higher. The extra length we get is the first derivative at those price levels. It basically comes down to how much bars our channel line gets longer if we widen our channel with one cent to the upside. The same goes for the lower Chartmill Channel line while decrementing each time with one cent. By doing this incrementally for every cent, we can get the optimum as the biggest increase in length we gain for any cent we widened the channel line during the iteration.
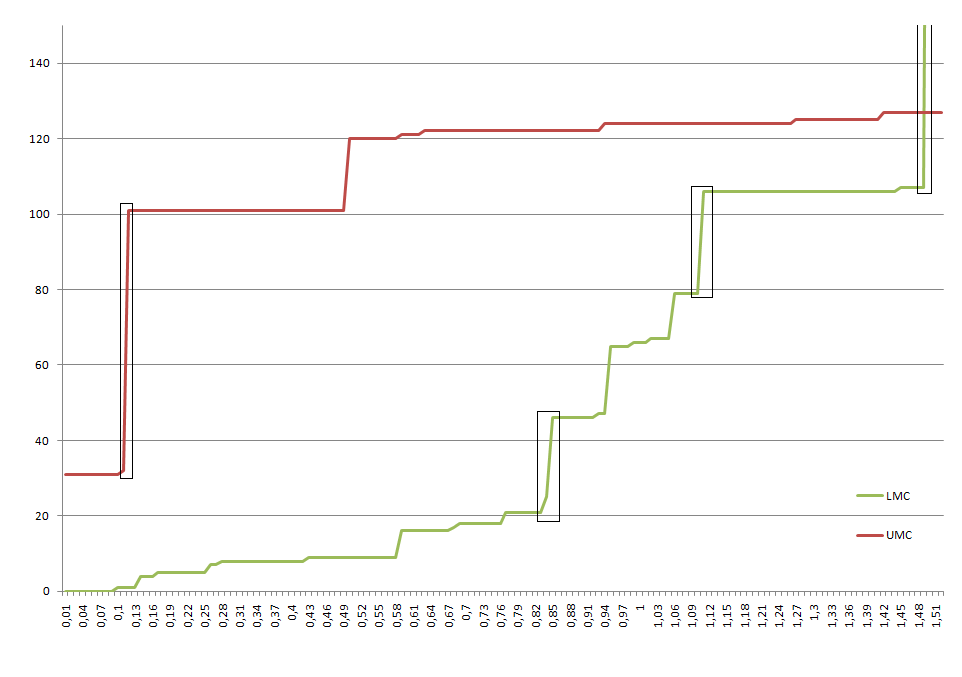
Let’s go back to our example from figure 1, as figure 2 charts this gain in length for every increase in width by one cent. What this chart is telling us, is how much longer the Chartmill Channels become at every distance in price from the last close.
Look at the chart. You’ll see that the length of the upper Chartmill Channel line (annotated as UCC), jumps from 32 days to 101 days if we increase its height from 11 cents to 12 cents above the last close. Since the last close was 3.04, this means pulling up the channel line from 3.15 to 3.16 increasing it by 69 days in length. The biggest increase we get for a one cent increase in height.
The lower Chartmill Channel line is shown as LCC. This optimum is found the same way. Lowering the channel line from 1.94 to 1.93 gets us the largest increase in length, going from 79 to 106 days, an increase of 27 days. If we look further, the LCC length goes of the chart if we lower it to 1.54, increasing the length with 254 days for a total of 361 days. This kind of increase indicates a very important low, in this case even the all time low.
Usage
Chartmill Channels are easy to implement and available at www.chartmill.com where you not only can visualize them on charts for most American and European stocks. It’s also possible to scan over the whole stock universe in a myriad of ways, looking for Chartmill Channel based on their length, width, strength and breakouts. You can even make use of almost all other classic technical analysis tools, while searching.
Chartmill Channels’ first application is, of course, the detection of bases or ranges from where consolidated trends can lift off again or from where new trends can arise. The channels provide also one more way traders can place stops systematically as the channels, by the specifics of their definition, will coincide with swing points and find significant intermediate tops and bottoms.
A careful reader might argue there’s still the question of how far one must go back searching the maximum gain in length for an additional increase in width by one cent. In math theory the answer would be to go as far as possible. In our context, this would be as far as historical data is available. However from a practical standpoint the implementation on www.chartmill.com cuts of its search as soon as channel lines drift away more than 20% from the last close. We’re not concerned with length, nor width, in isolation. We’re mainly interested in their balance. That is why the scanner let’s you specify both dimensions without discarding the relevance to the other, thereby using the advantage of every ‘free’ length that arbitrarily chosen Donchian Channel would ride past.
Conclusion
Chartmill Channels free us of any parameters left to the discretion of the trader. They take in consideration both length and width of the channel, thus optimizing the balance between both dimensions. Their inception creates the possibility to automatically and objectively detect the same horizontal channels and support and resistance lines traders in different timeframes are drawn to, as time compression reaches a climax, leading to a breakout. Of course every chart will have his upper and lower Chartmill Band. In a secure trend this will lead to one of the bands being quite lengthy while the other being very short. Though this might seem a disadvantage at first it can lead to the detection of trends. Further research, nevertheless, will have to point this out.
Notes & Images
(†) Richard Davoud Donchian is mostly know for his pioneering work in commodity futures money management and is considered one of the founders of trend following investment and trading ideas. As suxh, even the very successful trend following systems of Richard Dennis and his, by now famous, Turtle Traders, are based on Donchian’s work.
F1 Donchian Channels
Donchian Channels are amongst the oldest and most basic channels in technical analysis. They are also known as x-bar high/low channels. But they are not completely objectively defined as, in this example, a 36 day upper Donchian Channel can be replaced with a 100 day upper Donchian Channel at the same price.
Source: Chartmill
F2 Optimal Donchian Channels
If we look for the maximum Donchian Channel length we can get at every price offset from the close of the most recent bar, we can spot the largest increase in length. That’s the place where we can find the optimal balance between width and length of the Monest Channels.
Source: custom Excel
F3 Chartmill Channels
Pickup of the chart setup in figure 1, now with Chartmill Channels added. In this implementation the channels use the highest close for the upper Chartmill Channel line and the lowest close for the lower Chartmill Channel line.
Source: www.chartmill.com