VWAP (Anchored and Moving)
VWAP - Volume Weighted Average Price
VWAP is short for Volume Weighted Average Price.
VWAP is often used in algorithmic trading and/or as a trading benchmark by large investors to ensure a descent execution price for clients but you can use it for other interesting purposes as well.
In Chartmill, you can add both anchored and moving VWAPS to your chart.
VWAP - Definition
The VWAP or Volume Weighted Average Price plots the average price a stock has traded over a period by taking in account the volume on each candle.
If we extend the idea of this VWAP over several days, such an average can, just like the classical averages, be used as support, resistance, and consequently also for setting targets and stops.
Moreover, this VWAP can be calculated over a shifting window with fixed length, just like the classic sliding averages. We speak by analogy of a moving VWAP. But one might as well define the starting point of this interval and increase the length of the interval as we get new data (every day). We then speak of an anchored VWAP. In this case, the starting point of the interval over which the VWAP is calculated is pinned to an important event (such as a top or bottom or even fundamental issues such as news or figures).
An anchored VWAP can thus be used to represent the ‘pain/pleasure’ limit of an average purchased share since that event, top or bottom. Anchored VWAPs turn out to be very good resistance and support lines.
A drawback is that as the starting point gets older, the event becomes less relevant. As a result, an anchored VWAP has the natural tendency to become increasingly flatter (and thus to distance itself further and further from the price). This problem can easily be overcome by taking more recent points as a new starting point for an anchored VWAP. This way you get a VWAP range.
Moving VWAP chart indicator
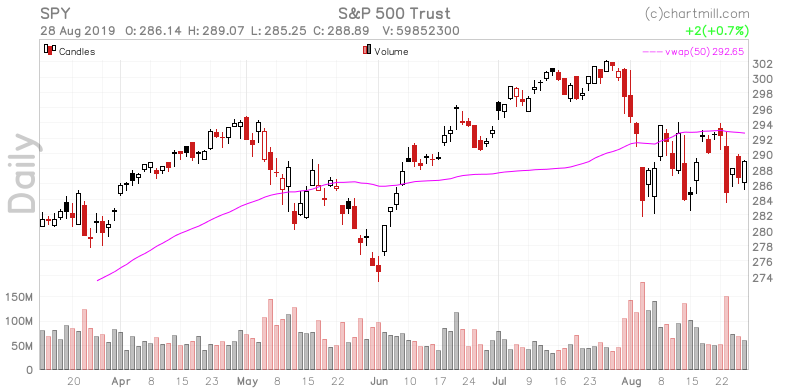
This indicator is available in our stock charts and you can find the indicator between the overlays. It takes one parameter which is the period over which the VWAP should be calculated. A Moving VWAP over a period of 50- days gives a trader information on the average price traded over the last 50-days adjusted by volume. Besides the period, you can also specify the color when you add the indicator.
This is an example chart of SPY with a 50 day moving VWAP overlay indicator added:
Anchored VWAP chart indicator
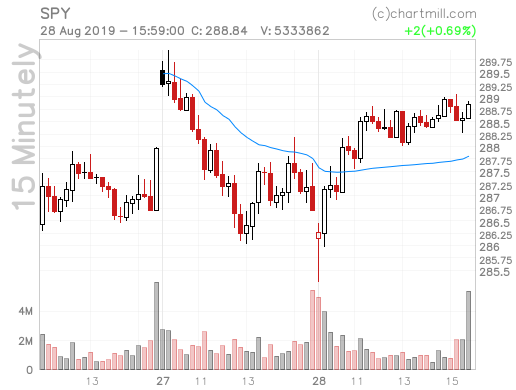
With an anchored VWAP you can check if buyers are mainly in winning or losing positions over a certain period of time. In this case the main parameter of the indicator is the number of candles you should go back to find the starting candle for the calculation.
In the following chart we've drawn an anchored VWAP on an intraday SPY charts that starts exactly at the open 2 days ago. (or 51 candles back).
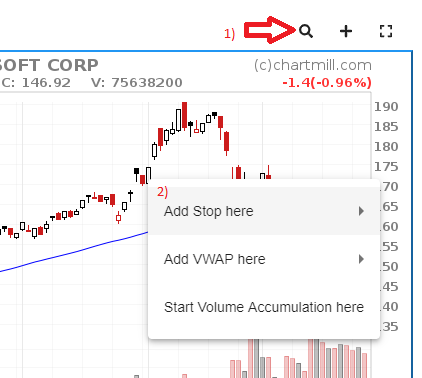
Anchored Indicators can be added from the chart
The ‘Anchored VWAP’ is a so called anchored indicator. Anchored indicators have a parameter that indicates on which candle the indicator needs to anchored. For ease of use you can add these indicators on the chart itself by just pointing at the candle where you want to anchor it to. This can be done by:
- Click the inspect icon above the chart to enable candle details while you hover over the chart.
- Find the candle where you want to anchor an indicator to, right click and select the desired indicator.