The Shooting Star Candle in Stock Trading
What Does a Shooting Star Candle Look Like?
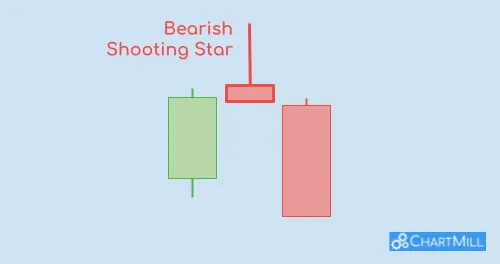
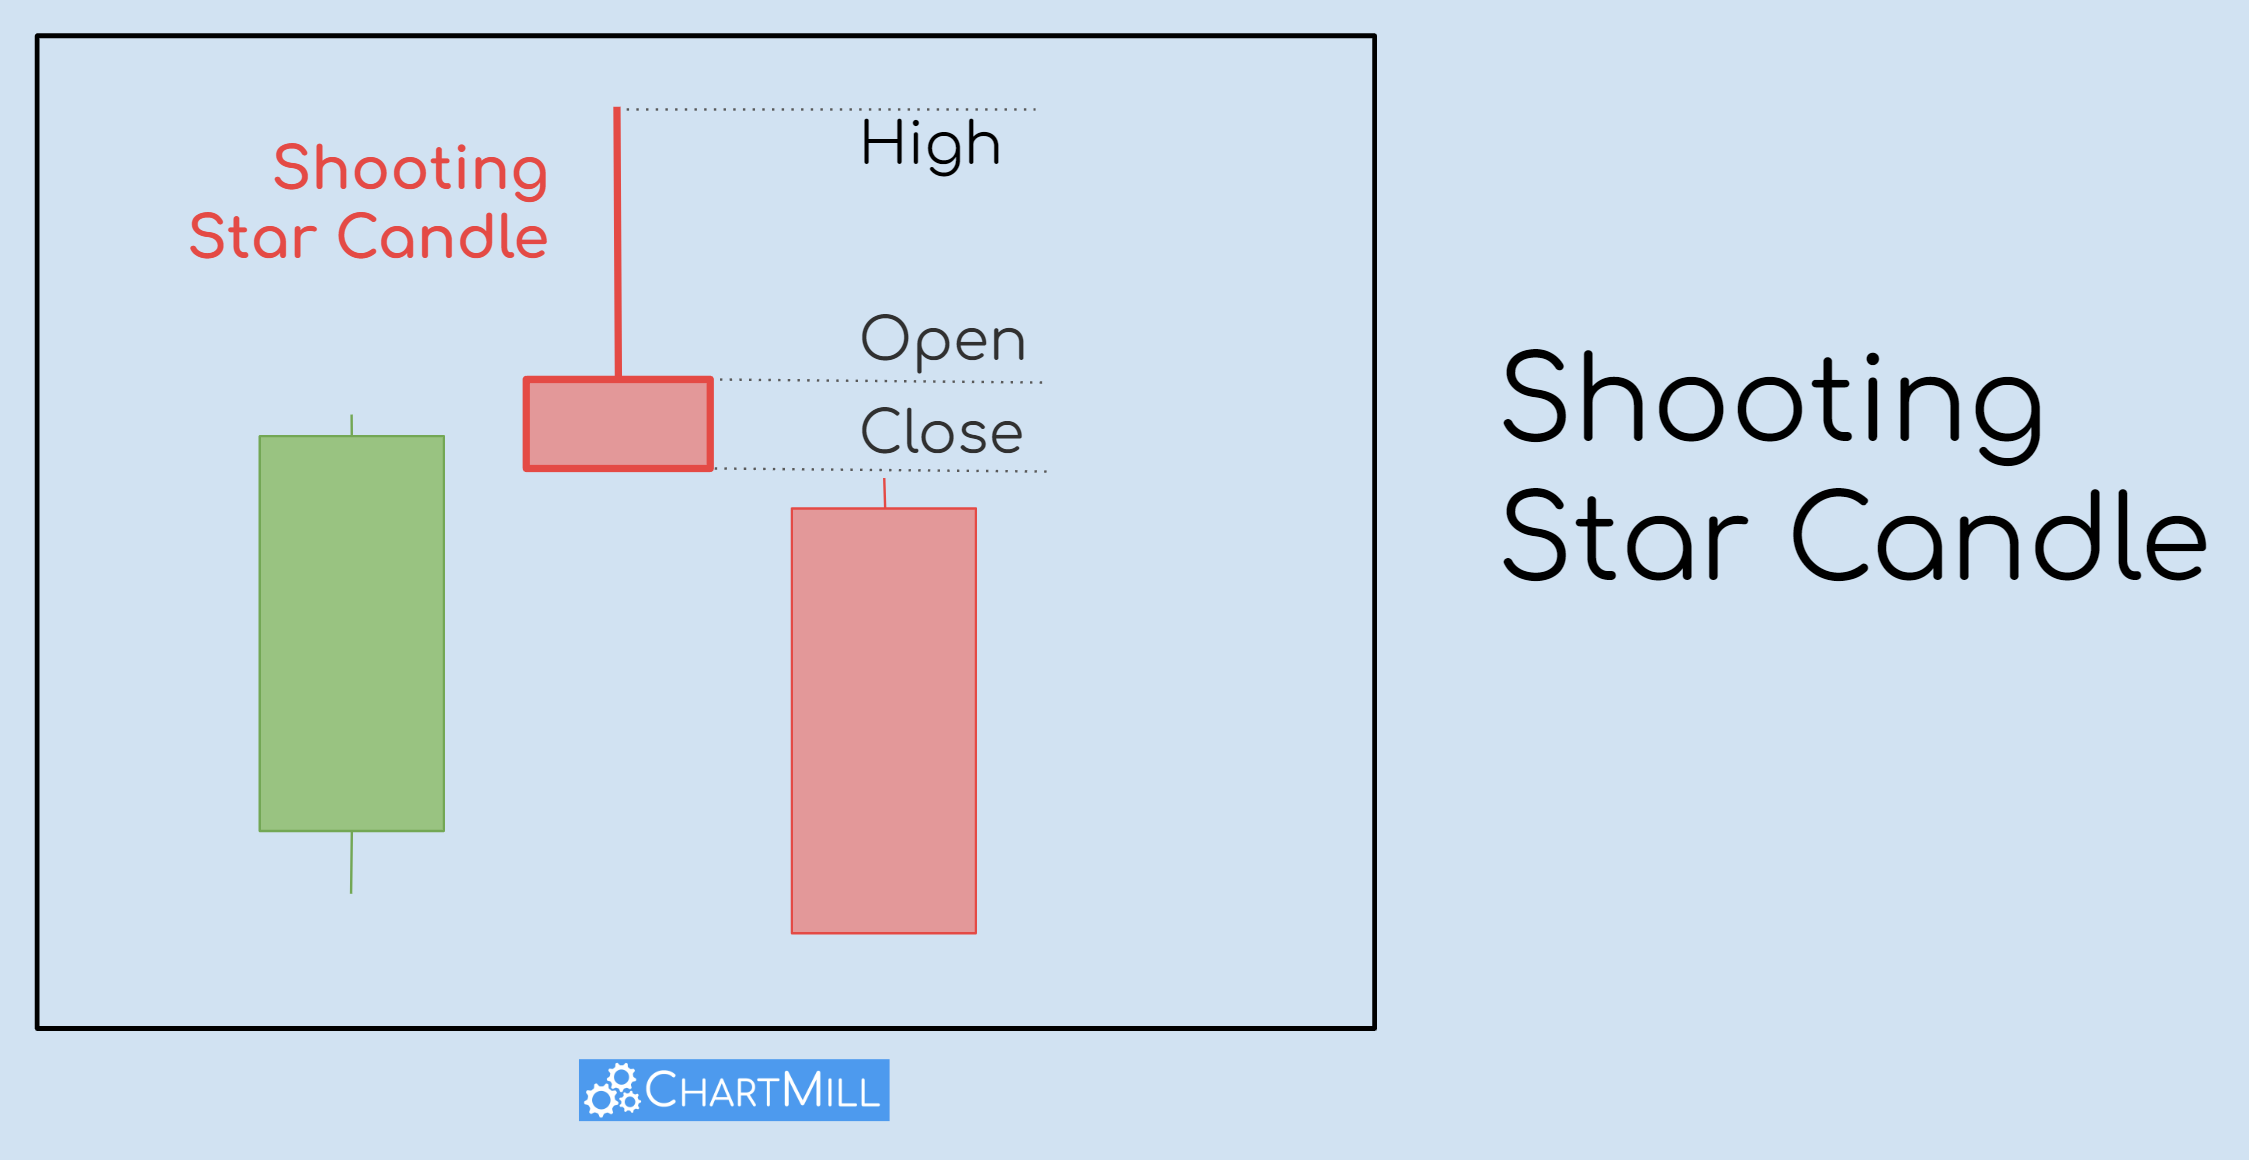
A shooting star candle is a bearish reversal candlestick chart pattern that often occurs at the end of an uptrend. It has a distinct shape characterized by a small real body near the bottom of the candle and a long upper shadow (wick) that is at least twice as long as the real body. The pattern takes its name from its resemblance to a shooting star with a long tail.
The length of the upper shadow in a shooting star pattern is significant. The longer the upper shadow, the stronger the indication of a possible reversal. There is no fixed length that determines the validity of the pattern, but in general, a relatively long upper shadow compared to the actual body of the candlestick is considered more reliable.
Price action traders often look for shooting stars with an upper shadow that is at least twice as long as the body.
Their appearance resembles a star falling from the sky, hence the name "shooting star." This pattern usually occurs after an uptrend and signals a possible reversal of the market.
Key Findings
- The shooting star is a bearish reversal chart pattern that indicates a potential trend reversal froman uptrend to a downtrend
- It occurs when the price opens higher, rallies, but then sells off and closes near or below the opening price
- The pattern is characterized by a small real body, a long upper shadow, and little to no lower shadow.
- The length of the upper shadow is significant, with a longer shadow indicating a stronger potential reversal signal
- Traders often look for confirmation signals such as a bearish follow-through or a subsequent downtrend before taking action
How Do You Interpret a Shooting Star Candlestick Pattern?
The shooting star pattern provides valuable information to traders. It indicates that the bulls were initially in control, and drove the price higher, but lost momentum as the session progressed.
The long upper shadow represents the failed attempt to maintain the upward momentum, and the small real body indicates a possible change in sentiment from bullish to bearish.
It warns traders of a possible trend reversal and indicates that selling pressure is increasing.
However, it is important to note that a shooting star alone does is no guarantee of a reversal. Traders should look for confirmation signals before making trading decisions.
Seeing a shooting star pattern on a price chart can provide additional insight. Although a shooting star is usually considered bearish regardless of its position, the pattern is much more reliable when it occurs at the end of a temporary uptrend, while the main trend is still bearish.
Trade The Shooting Star Pattern
When you spot a shooting star pattern, it is important that you wait for confirmation signals before taking action. The shooting star alone is not enough to make trading decisions.
Traders often look for additional signs that support a possible reversal. Some common strategies used in conjunction with the shooting star pattern are:
-
Bearish confirmation: Traders wait for a bearish follow-through, such as a down day with a lower low, to confirm the shooting star pattern
-
Support and resistance levels: If the shooting star occurs near a significant resistance level, this reinforces the bearish signal. On the other hand, if it occurs near a strong support level, the signal may be less reliable.
-
Technical indicators: Traders can use technical indicators such as moving averages, volume, trendlines, or oscillators to complement the shooting star pattern and confirm the potential reversal. It is important to combine the shooting star pattern with other technical analysis tools and indicators to increase the probability of a successful trade.
-
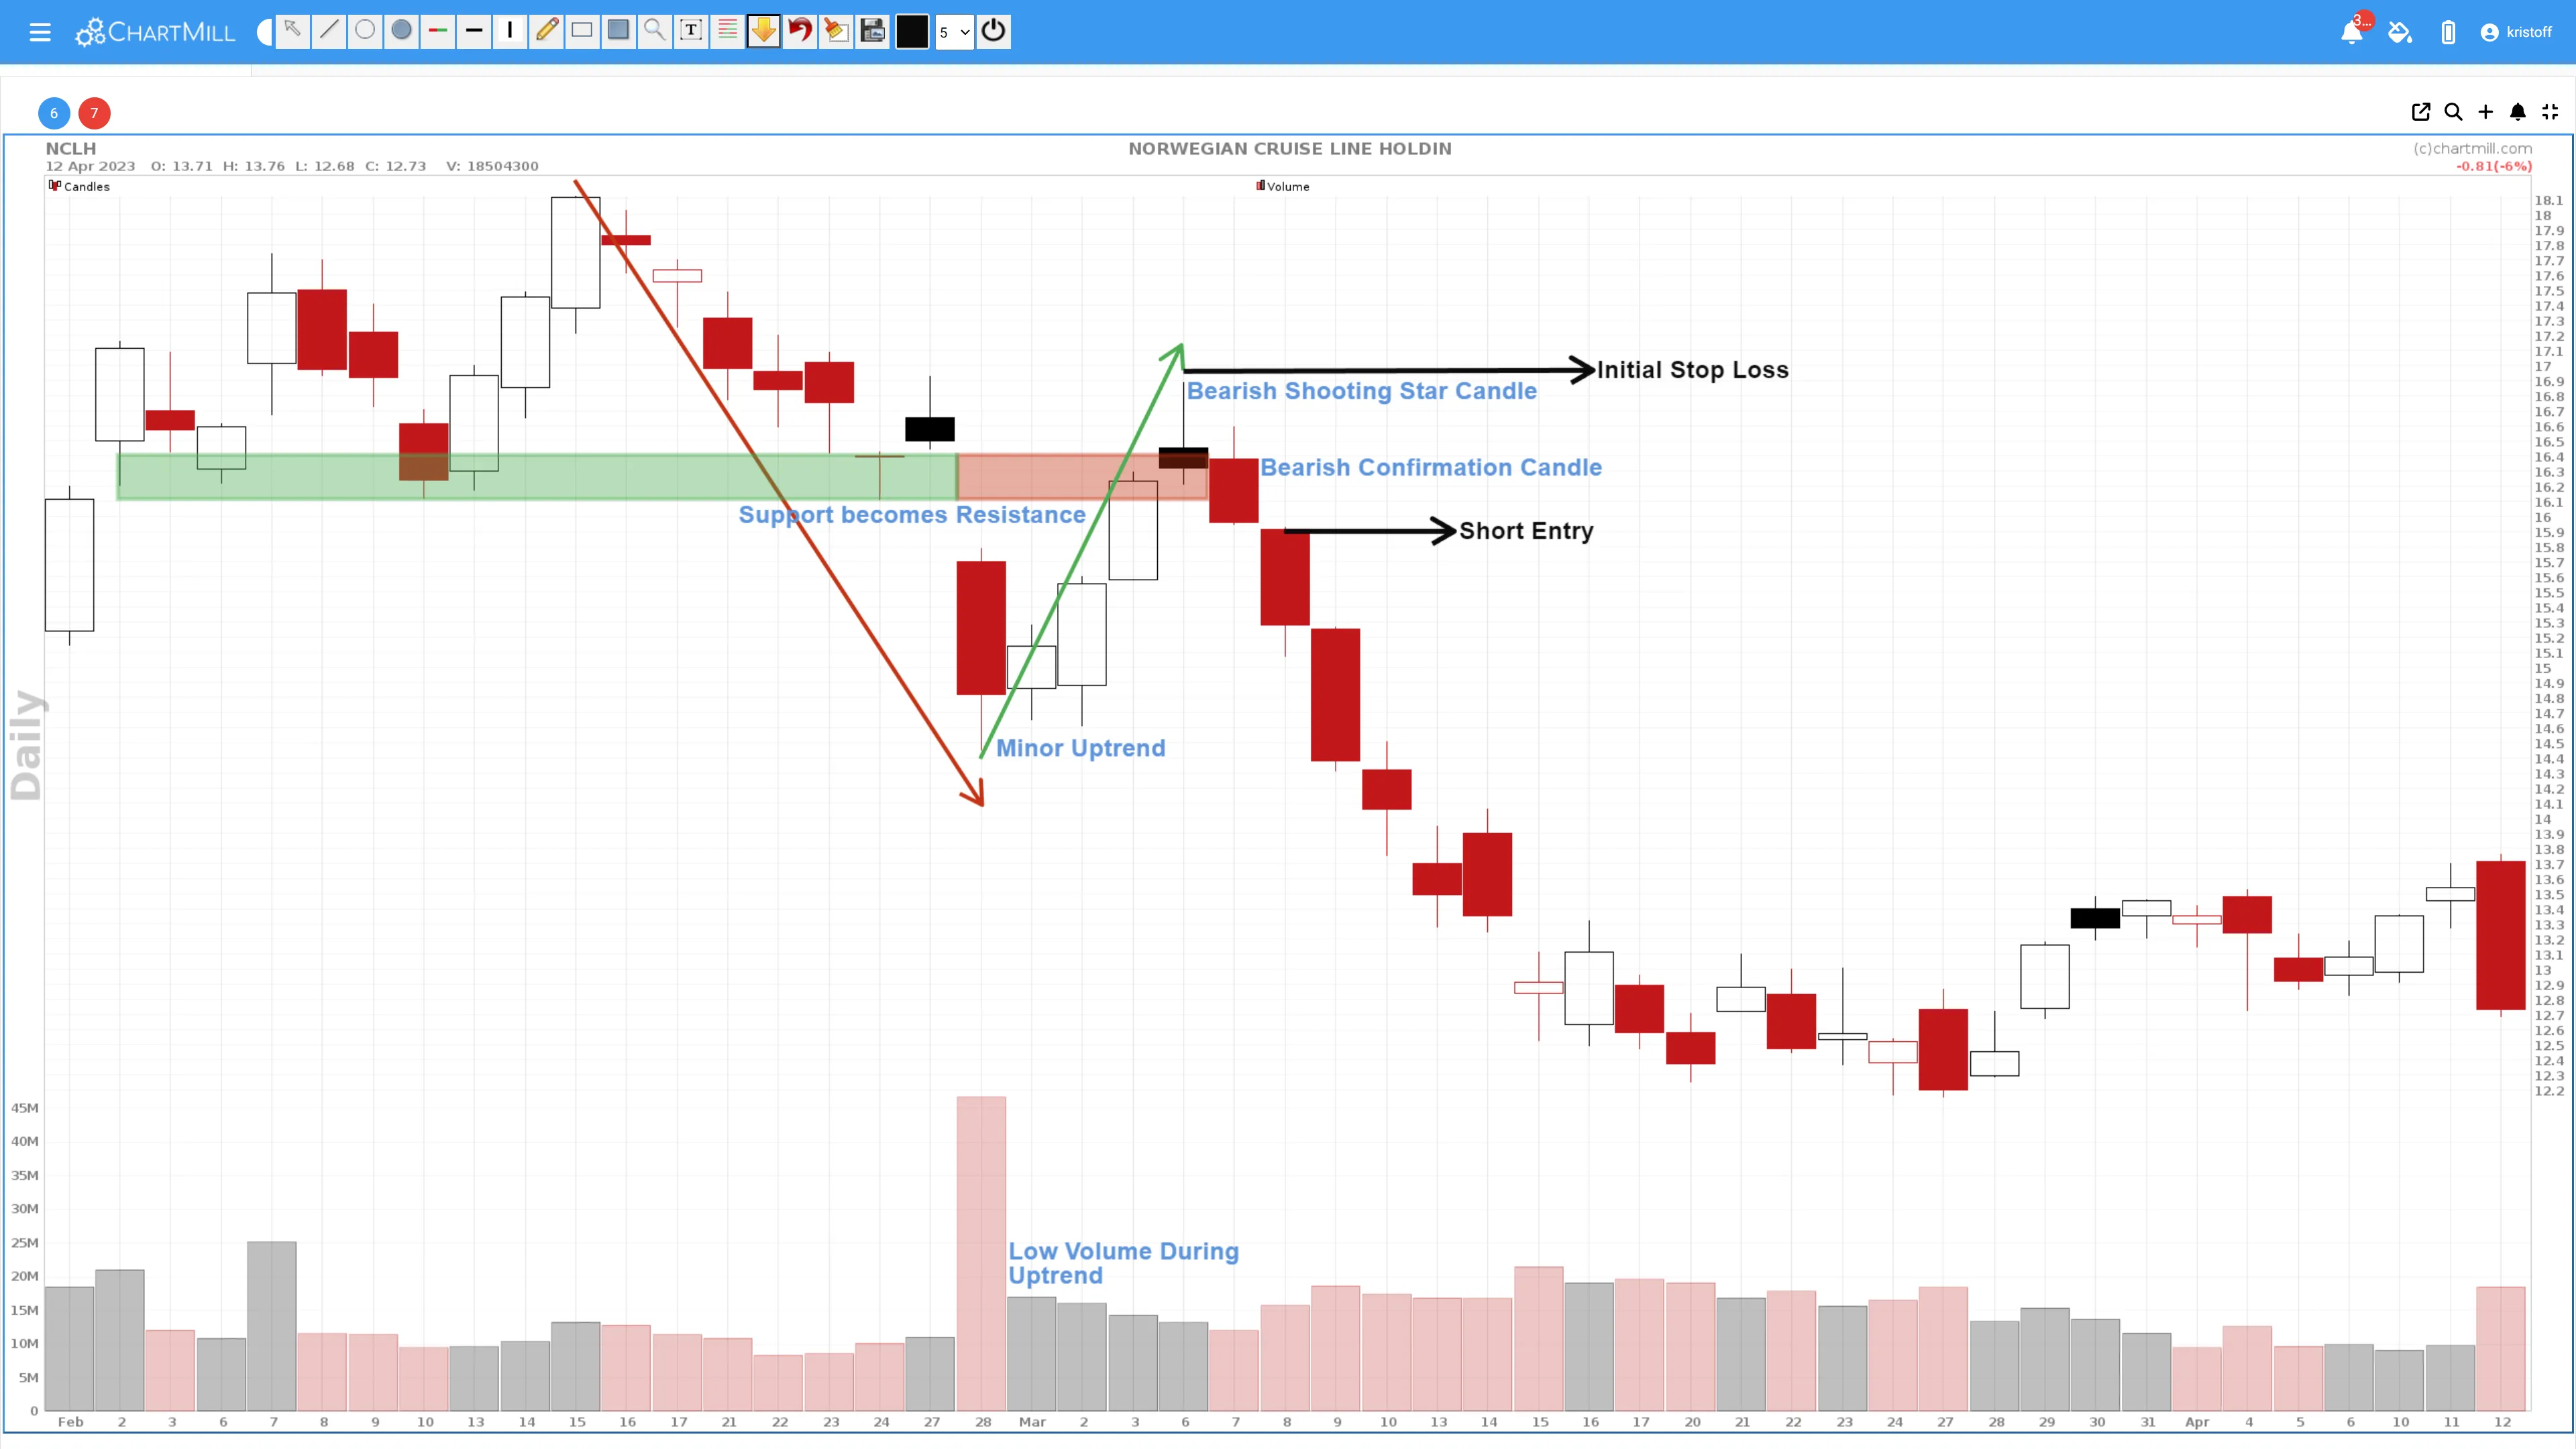
A bearish shooting star candle formed on March 6, after the price initially rose for three consecutive days to the $16.5 price level.
-
Note that this price increase occurred on relatively low volume. Furthermore, the bearish shooting star pattern formed at an earlier support level which then acted as resistance.
-
The following day, the price declined and closed the trading day at the lowest intraday price. This was the confirmation candle.
-
A short entry just below the bearish confirmation candle with a short stop-loss just above it and an initial price target around $14.5 (the last swing low) was certainly an acceptable setup from a risk/reward perspective.
The Shooting Star Compared To The Inverted Hammer Candlestick
The shooting star pattern is often confused with the inverted hammer pattern, as they have a similar appearance. However, there is one key difference between the two.
In the shooting star pattern, the closing price is near or below the opening price and the body has a long upper shadow, indicating a potential bear market. On the other hand, the inverted hammer pattern has a small real body at the top and a long bottom shadow, that indicates potential bullishness. The inverted hammer occurs after a downward trend and signals a possible reversal.
While the shooting star indicates a bearish reversal, the inverted hammer implies a bullish reversal. It is important to distinguish between these two patterns to correctly interpret market sentiment.
How to Find the Shooting Star Pattern?
To identify the shooting star pattern, you need to watch the stock price charts closely. Look for candles with long upper shadows and small real bodies near the top of an uptrend.
Several technical analysis tools and platforms provide automatic detection of candlestick patterns, including the shooting star pattern.
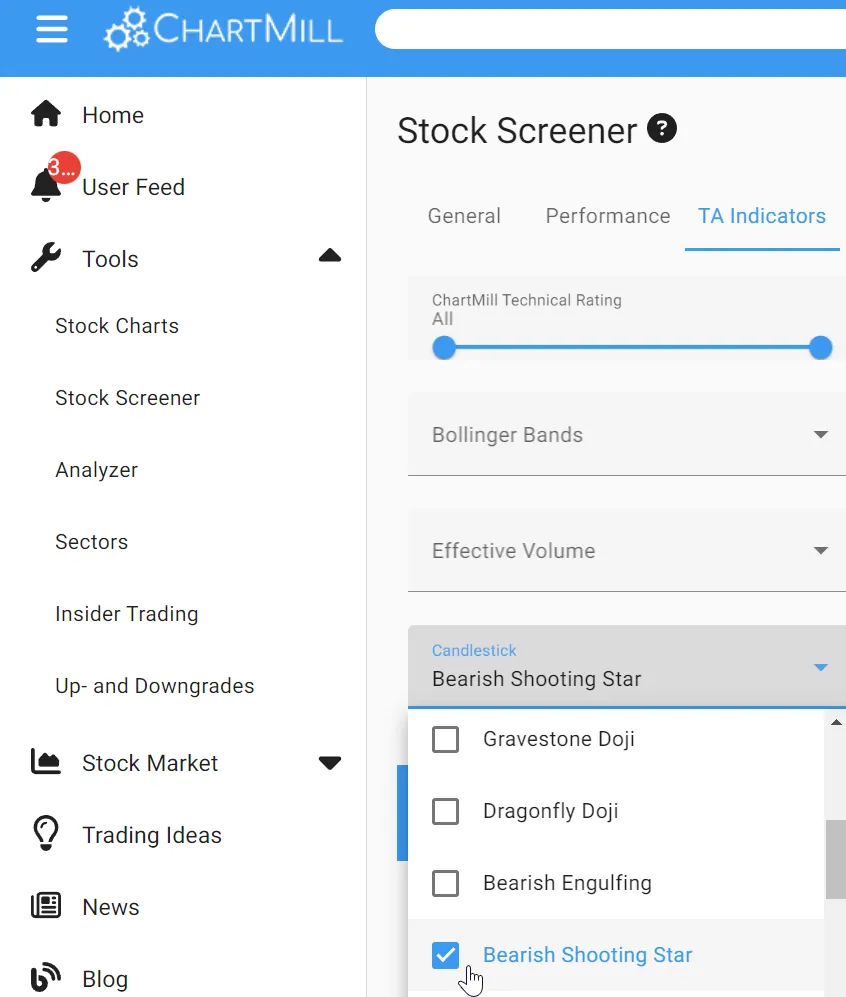
In ChartMIll Stock Screener, the "shooting star" pattern is automatically detected. So you can use it as a screening filter.
To do so, on the stock screener page, select the TA Indicators menu and open the drop-down menu under 'Candlestick'. Finally, select the 'Bearish Shooting Star' pattern.
Is the Shooting Star pattern reliable?
According to thepatternsite.com, the reliability of the candlestick itself is rather limited. Only in 57% of the cases there was a decline after such a candle. Therefore, it is important not only to look at the candle itself, but to wait for a confirmation candle in any case.
The data also shows that the pattern works best when it occurs at the end of an intermediate uptrend in a long-term downtrend. See the chart above for an example.
Limitations of the Shooting Star
Although the shooting star pattern can provide valuable insights, it is important to be aware of its limitations.
-
False signals: Like any technical analysis tool, the shooting star pattern is not foolproof and can produce false signals. Traders should wait for confirmation before making trading decisions.
-
Market context: The shooting star pattern should be viewed in the broader market context. Factors such as the overall trend, volume, and market fundamentals should also be considered for a comprehensive analysis.
-
Timeframe: The shooting star pattern is usually more effective on higher time frames, such as daily or weekly charts. It may be less reliable on shorter intraday time frames.
-
Additional analysis: Relying on the shooting star pattern alone may not be sufficient. Traders should use it in conjunction with other technical indicators and analysis techniques to increase the accuracy of their predictions.
Conclusion
The Shooting Star candlestick pattern is a powerful stock trading tool that can provide valuable insight into potential trend reversals. It indicates a change in sentiment from bullish to bearish and warns traders of increasing selling pressure.
Although the Shooting Star pattern has its limitations and can generate false signals, it remains a widely recognized and used pattern in technical analysis.
When using this specific candlestick pattern, the broader market context must also be considered. What is the overall market trend and related market sentiment? How is the sector performing from which the stock for which we have identified such a candlestick pattern? Are there other analysis techniques that produce converging signals in line with this pattern?
Remember that successful trading requires a comprehensive approach that combines various tools, indicators, and market knowledge.
FAQs
Can the shooting star pattern occur in any market?
Yes, the shooting star pattern can occur in various markets, including stocks, forex, commodities, and cryptocurrencies. It is a widely recognized candlestick pattern used in technical analysis.
What is the significance of the shooting star pattern?
The shooting star pattern indicates a potential trend reversal from an uptrend to a downtrend. It suggests that buying pressure has waned and selling pressure may be increasing.
How can I recognize a shooting star pattern?
To spot a shooting star pattern, look for a candle with a small real body on the bottom and a long top shadow. The opening price should be higher than the previous day's closing price, and the closing price should be near or below the opening price.
Should I trade based on the shooting star pattern alone?
No, it is recommended to use the Shooting Star pattern in conjunction with other technical analysis tools and confirmation signals. This will help reduce false signals and increase the probability of a successful trade.