The Dragonfly Doji: a Candlestick Pattern to Recognize New Bullish Trends in an Early Stage.
The Dragonfly Doji is a unique candlestick pattern that often signals a potential market reversal. Recognized for its distinct shape, this pattern provides traders with valuable insight into market sentiment and trend changes.
In this guide, you'll learn how to identify the Dragonfly Doji, interpret its significance, and apply it effectively in your trading strategy.
How to Recognize a Dragonfly Doji Candlestick?
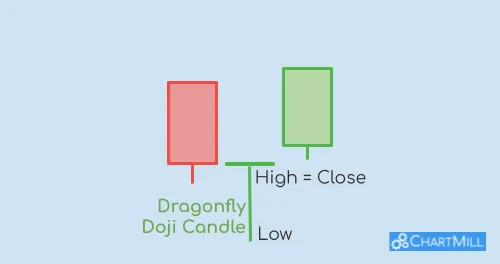
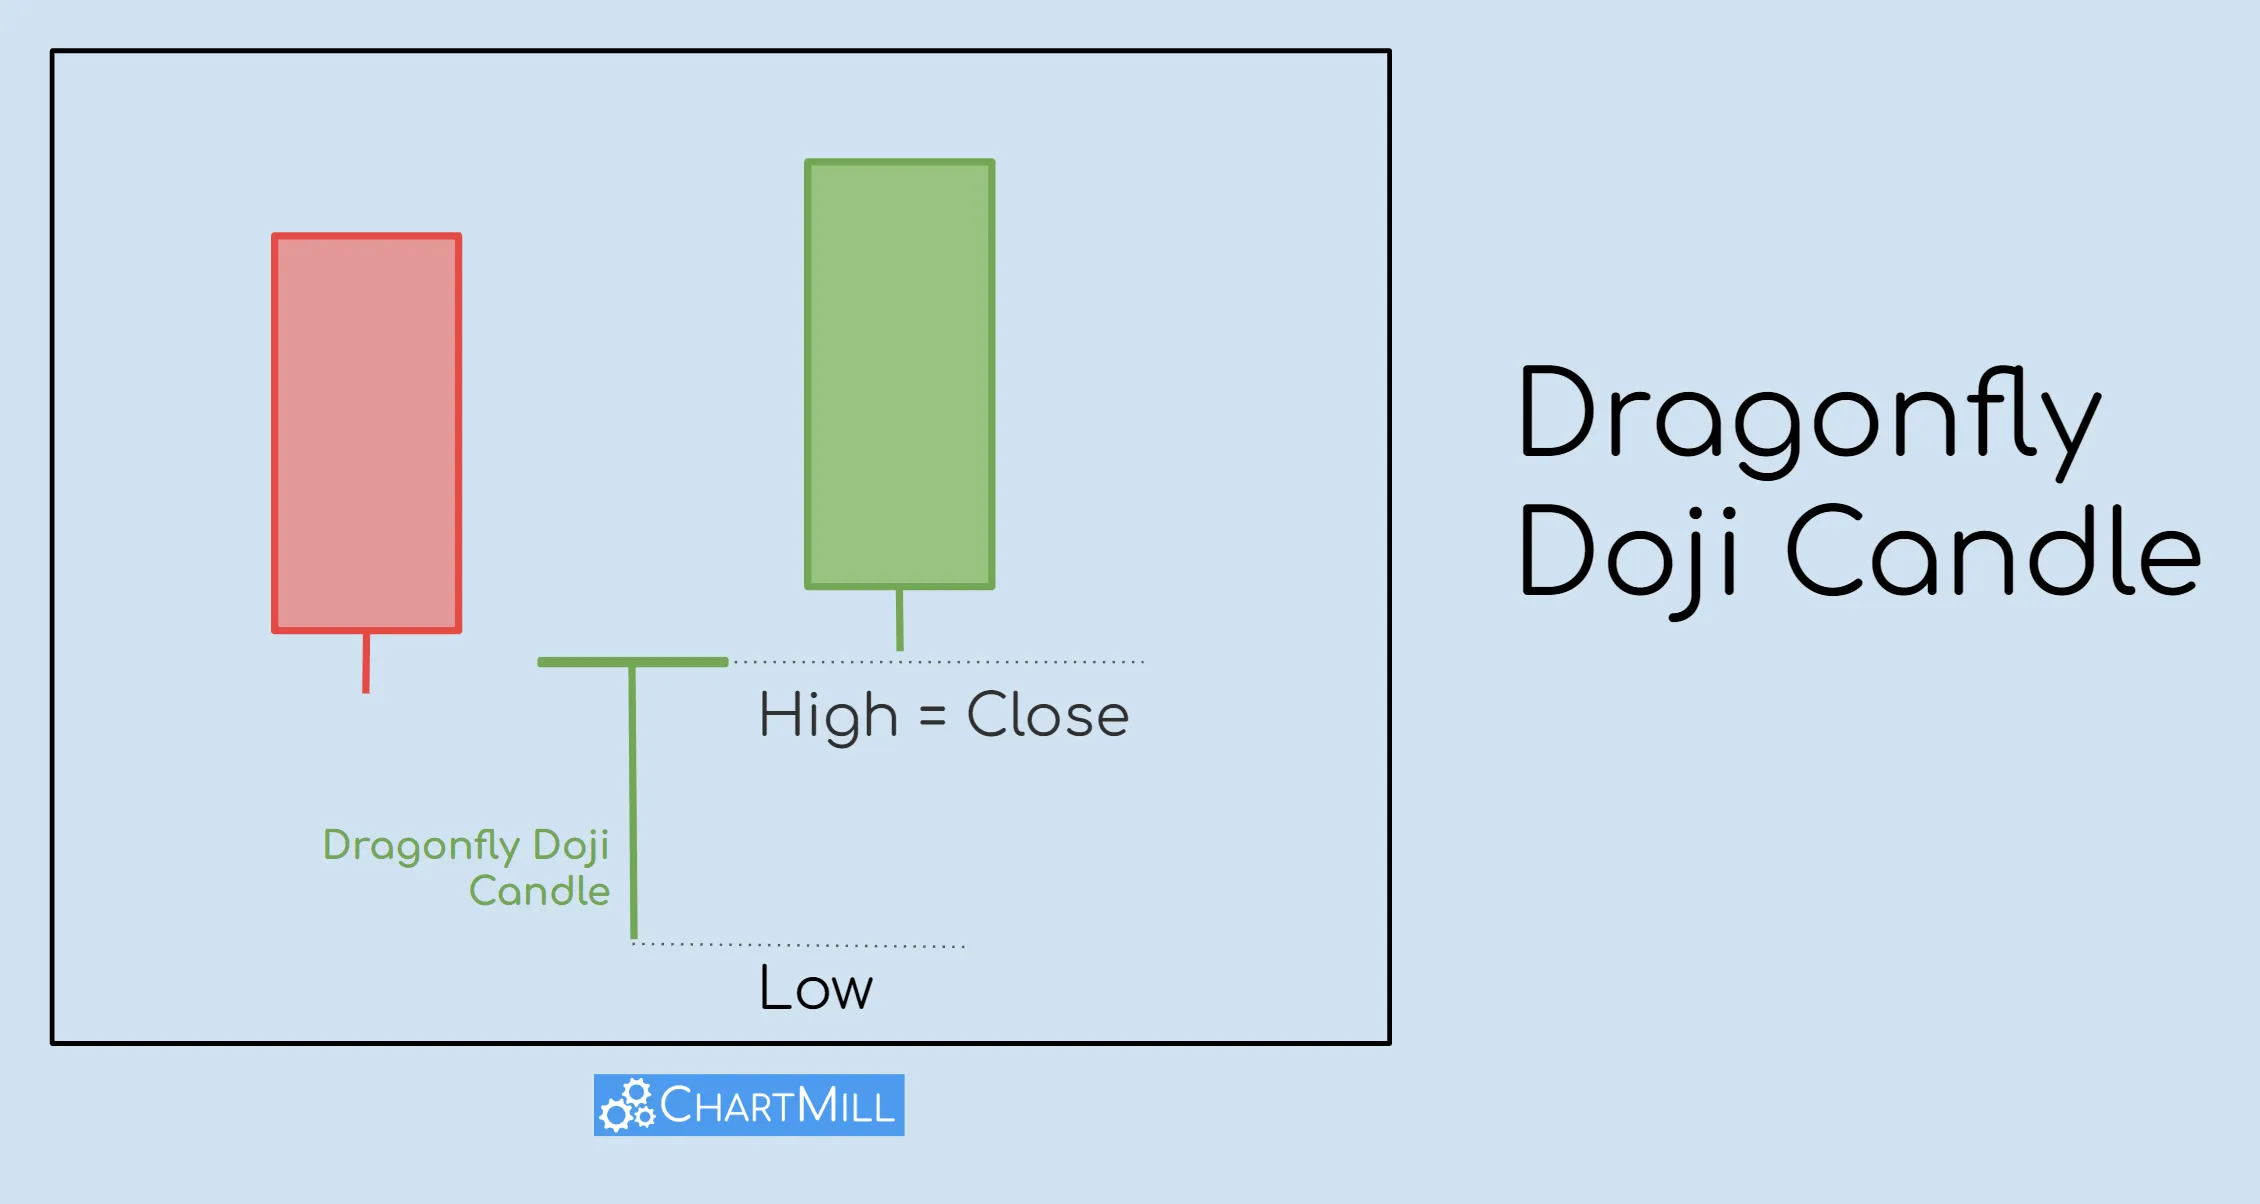
A Dragonfly Doji forms when the opening and closing prices of an asset are the same (or very close), while the low of the day creates a long lower shadow.
The result is a candlestick that resembles a “T” shape, with no upper shadow or a very small one.
Key Characteristics:
- Open and Close Prices: Virtually identical.
- Lower Shadow: Long and pronounced, indicating significant downward price movement during the session.
- Upper Shadow: Minimal or absent.
This pattern suggests that bears dominated the market early in the session, pushing prices lower, but bulls regained control, driving the price back to its opening level.
Psychology Behind the Dragonfly Doji
The Dragonfly Doji reflects market indecision.
The long lower shadow shows intense selling pressure during the session, but the closing price at or near the open suggests that bulls were strong enough to counter the bearish momentum.
Think of the Dragonfly Doji as a market tug-of-war where buyers finally gain control after an intense battle, leaving a long shadow behind as proof of their effort.
To identify a Dragonfly Doji, follow these criteria:
- Look for a small real body, or no real body at all, that is often colored or outlined differently from other candles.
- Notice a long lower shadow, indicating that prices dipped significantly during the session but recovered by the end.
- No upper shadow or an extremely short one.
The absence of an upper shadow further reinforces the dragonfly-like appearance.
Dragonfly Pattern Recognition in ChartMIll
Identifying a Dragonfly Doji manually across multiple charts can be time-consuming and challenging, especially for traders who analyze large watchlists.
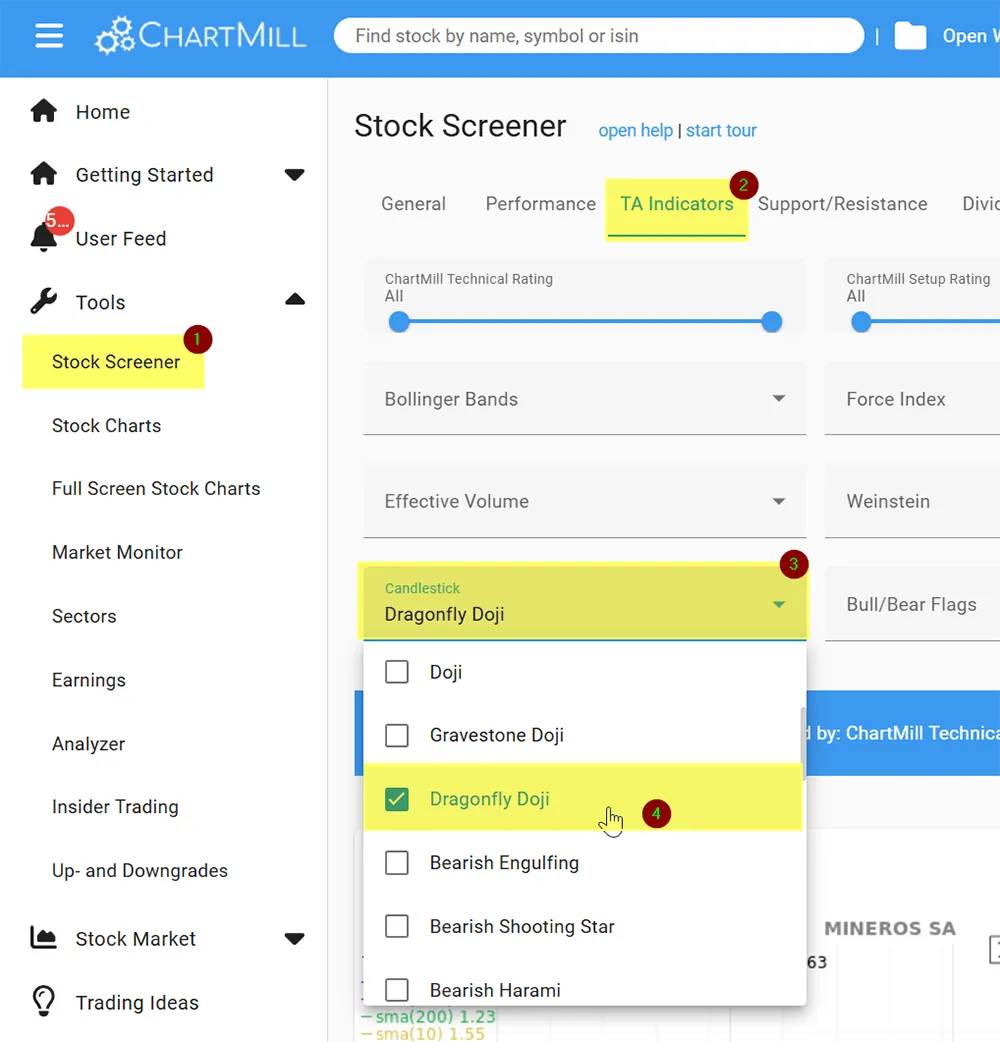
Fortunately, ChartMill offers a powerful screening tool that can automatically detect candlestick patterns like the Dragonfly Doji.
This feature is a significant time-saver and allows traders to focus on analyzing high-quality setups instead of searching for patterns manually.
To use this feature, simply apply the candlestick pattern filter within the ChartMill stock screener, select "Dragonfly Doji," and let the tool scan the market for you.
This is a direct link to a pre-configured screen that uses the ChartMill Candlestick recognition tool with the following parameters:
- US Only, price > $3
- Market Cap at least $300M (small caps)
- Average Trading Volume at least 100.000 shares
- Short Term Trend: negative or neutral
- Long Term Trend: positive or neutral
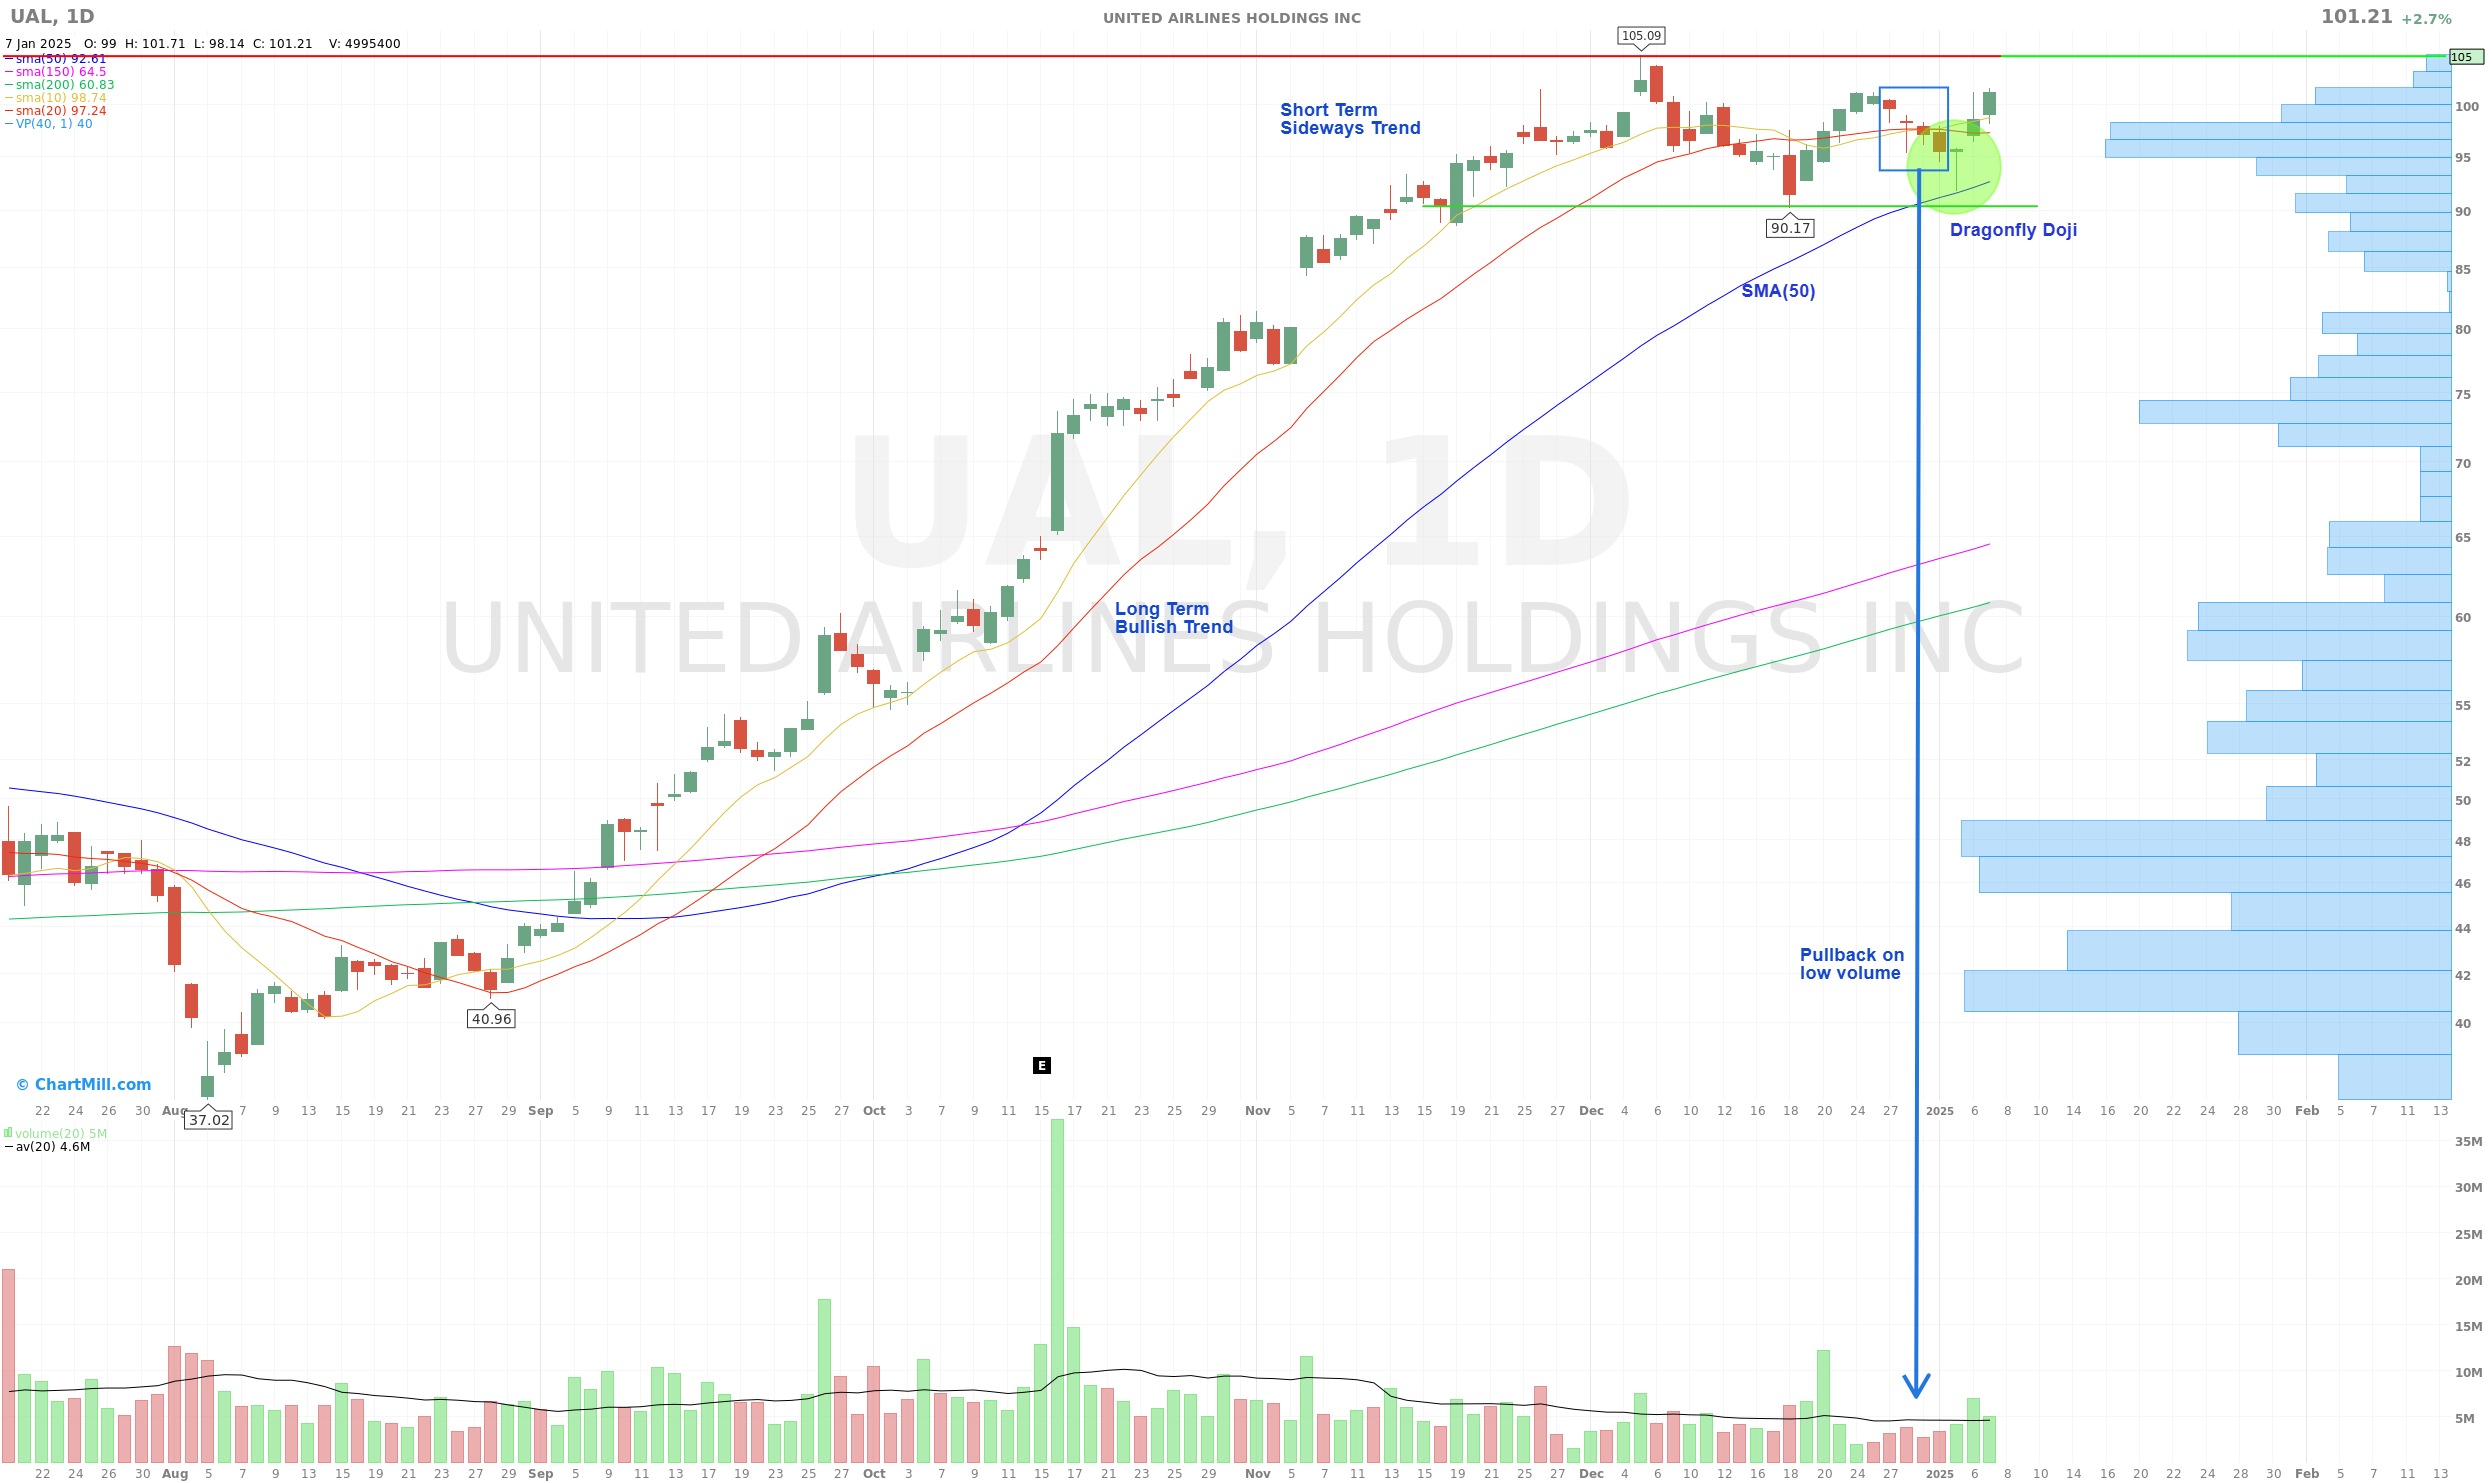
Example 1:
In the chart below (ticker: UAL), observe how the Dragonfly Doji formed in a sideways trend just after a pullback, while testing the SMA(50), followed by a strong recovery move in the following days.
Notice the low volume during the price retracement, suggesting reduced selling pressure.
Example 2:
This next chart shows two Dragonfly Dojis forming at the end of a pullback.
The first occurs in a clear uptrend where the price fell back to the SMA(20) price level.
The second time the decline is slightly more pronounced and the trend is rather neutral to slightly negative in the medium term. The price falls below the SMA(50) but is able to hold above the SMA(150) after which a dragonfly doji candlestick forms.
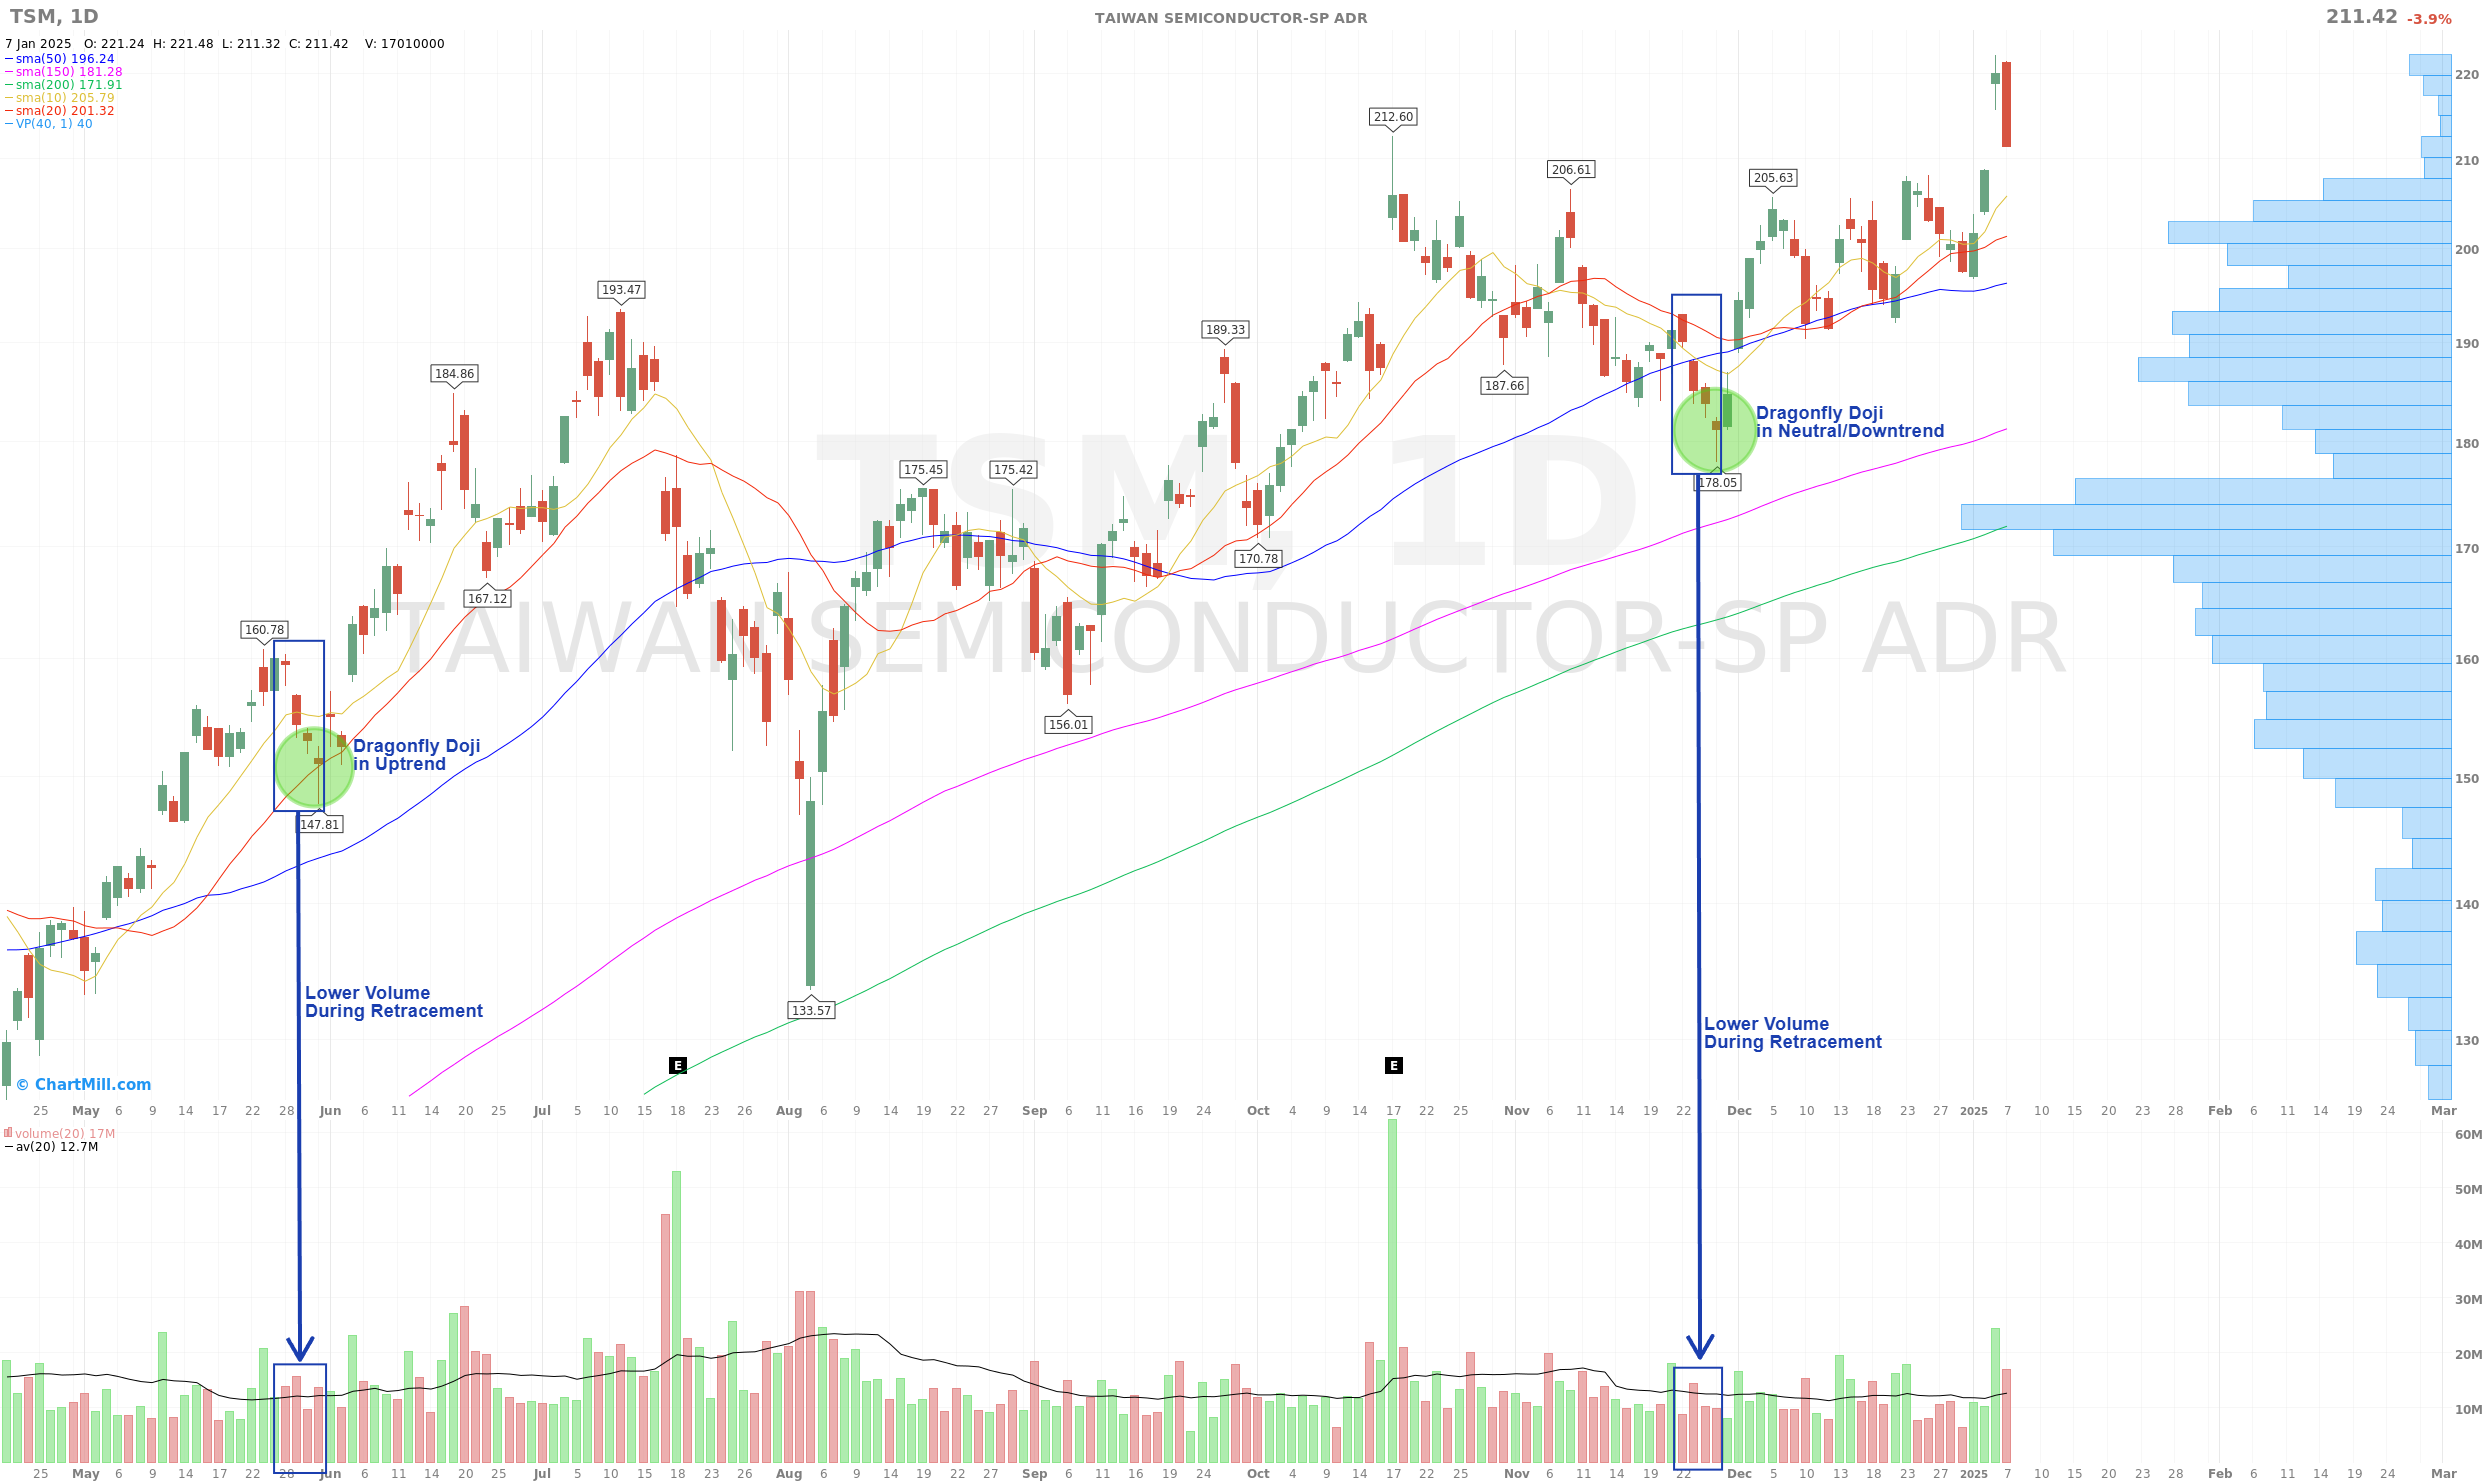
In both cases it is notable that the price drop occurs on lower volume than the earlier rise. This is an important confirmation when interpreting how reliable the Dragonfly Doji pattern is in that particular situation.
Trading Strategy Using Dragonfly Doji
Confirmation is Key
A single Dragonfly Doji is not enough to make a trading decision. Always wait for confirmation of the next candlestick and only enter a long position if the price rises above the high of the dragonfly doji candle.
Would you prefer even more confirmation? Then first wait to see if the next candle is bullish and only then enter the market. The disadvantage here is that you may have missed a significant part of the movement, not unimportant if you are mainly focused on relatively short-term momentum.
Support and Resistance Levels
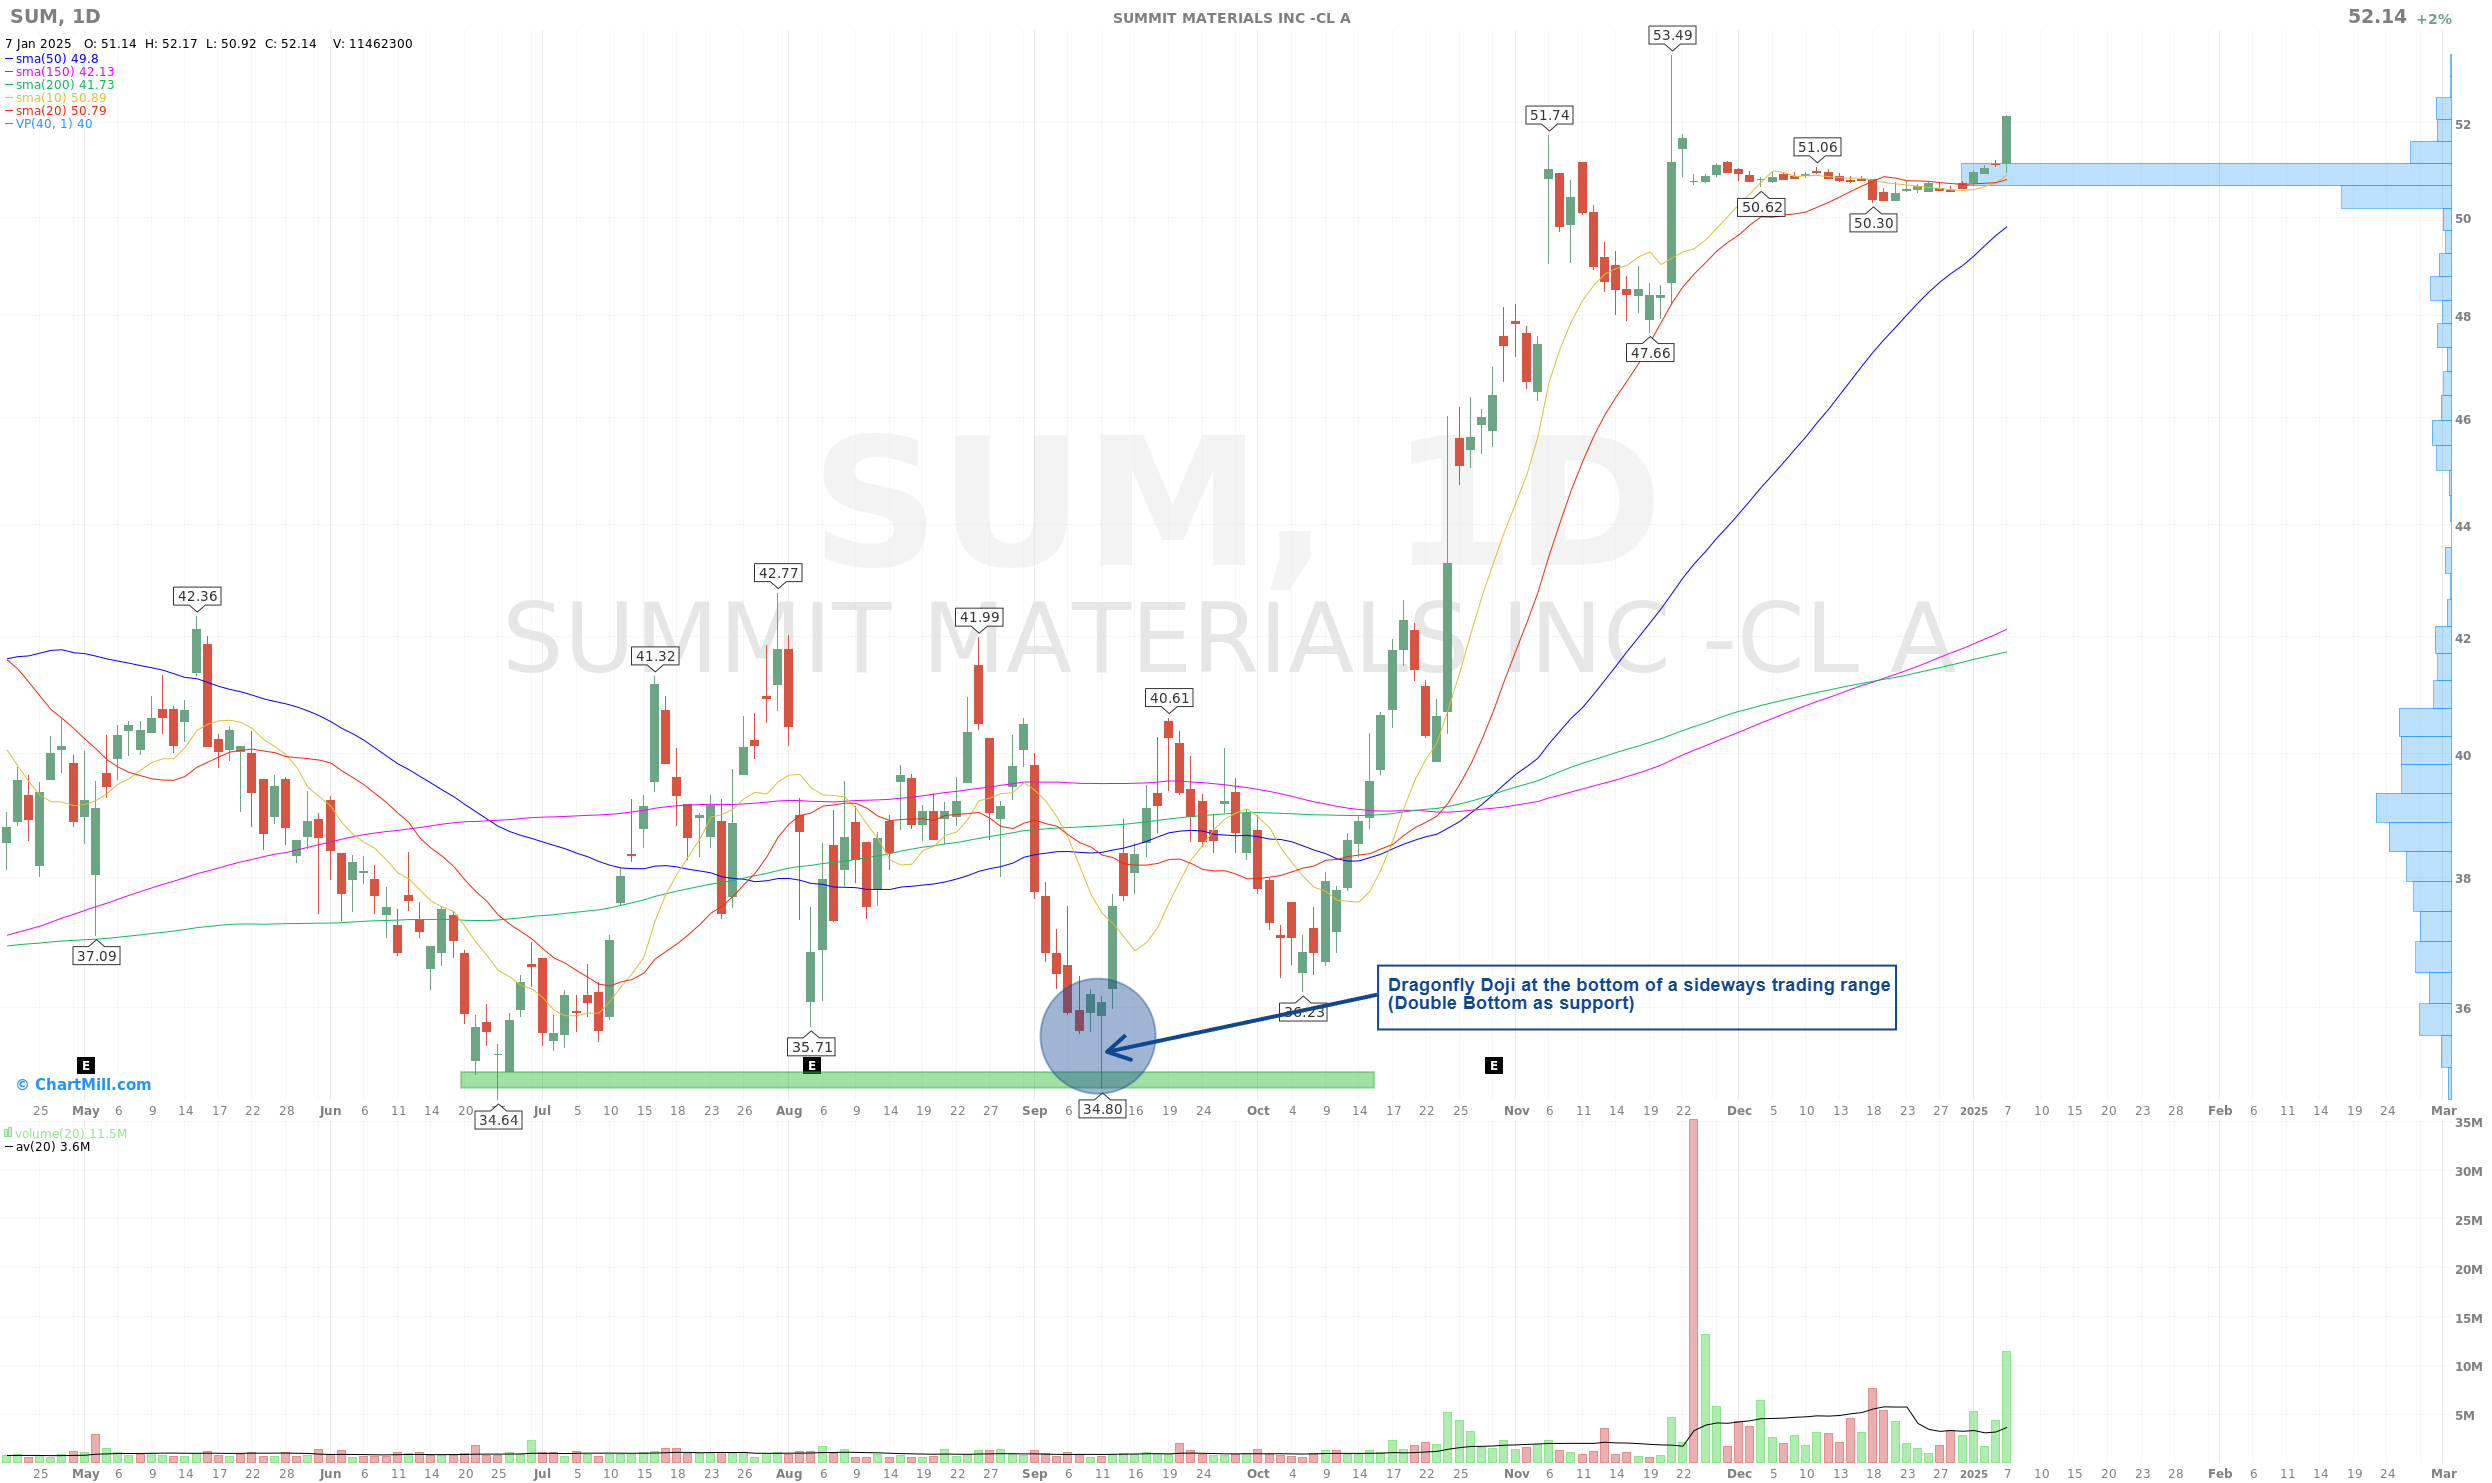
Always combine the Dragonfly Doji with key support or resistance levels.
The chart below (ticker: SUM) shows a dragonfly doji candle in a sideways trading range forming a double bottom. Meanwhile, the price has risen more than 45%.
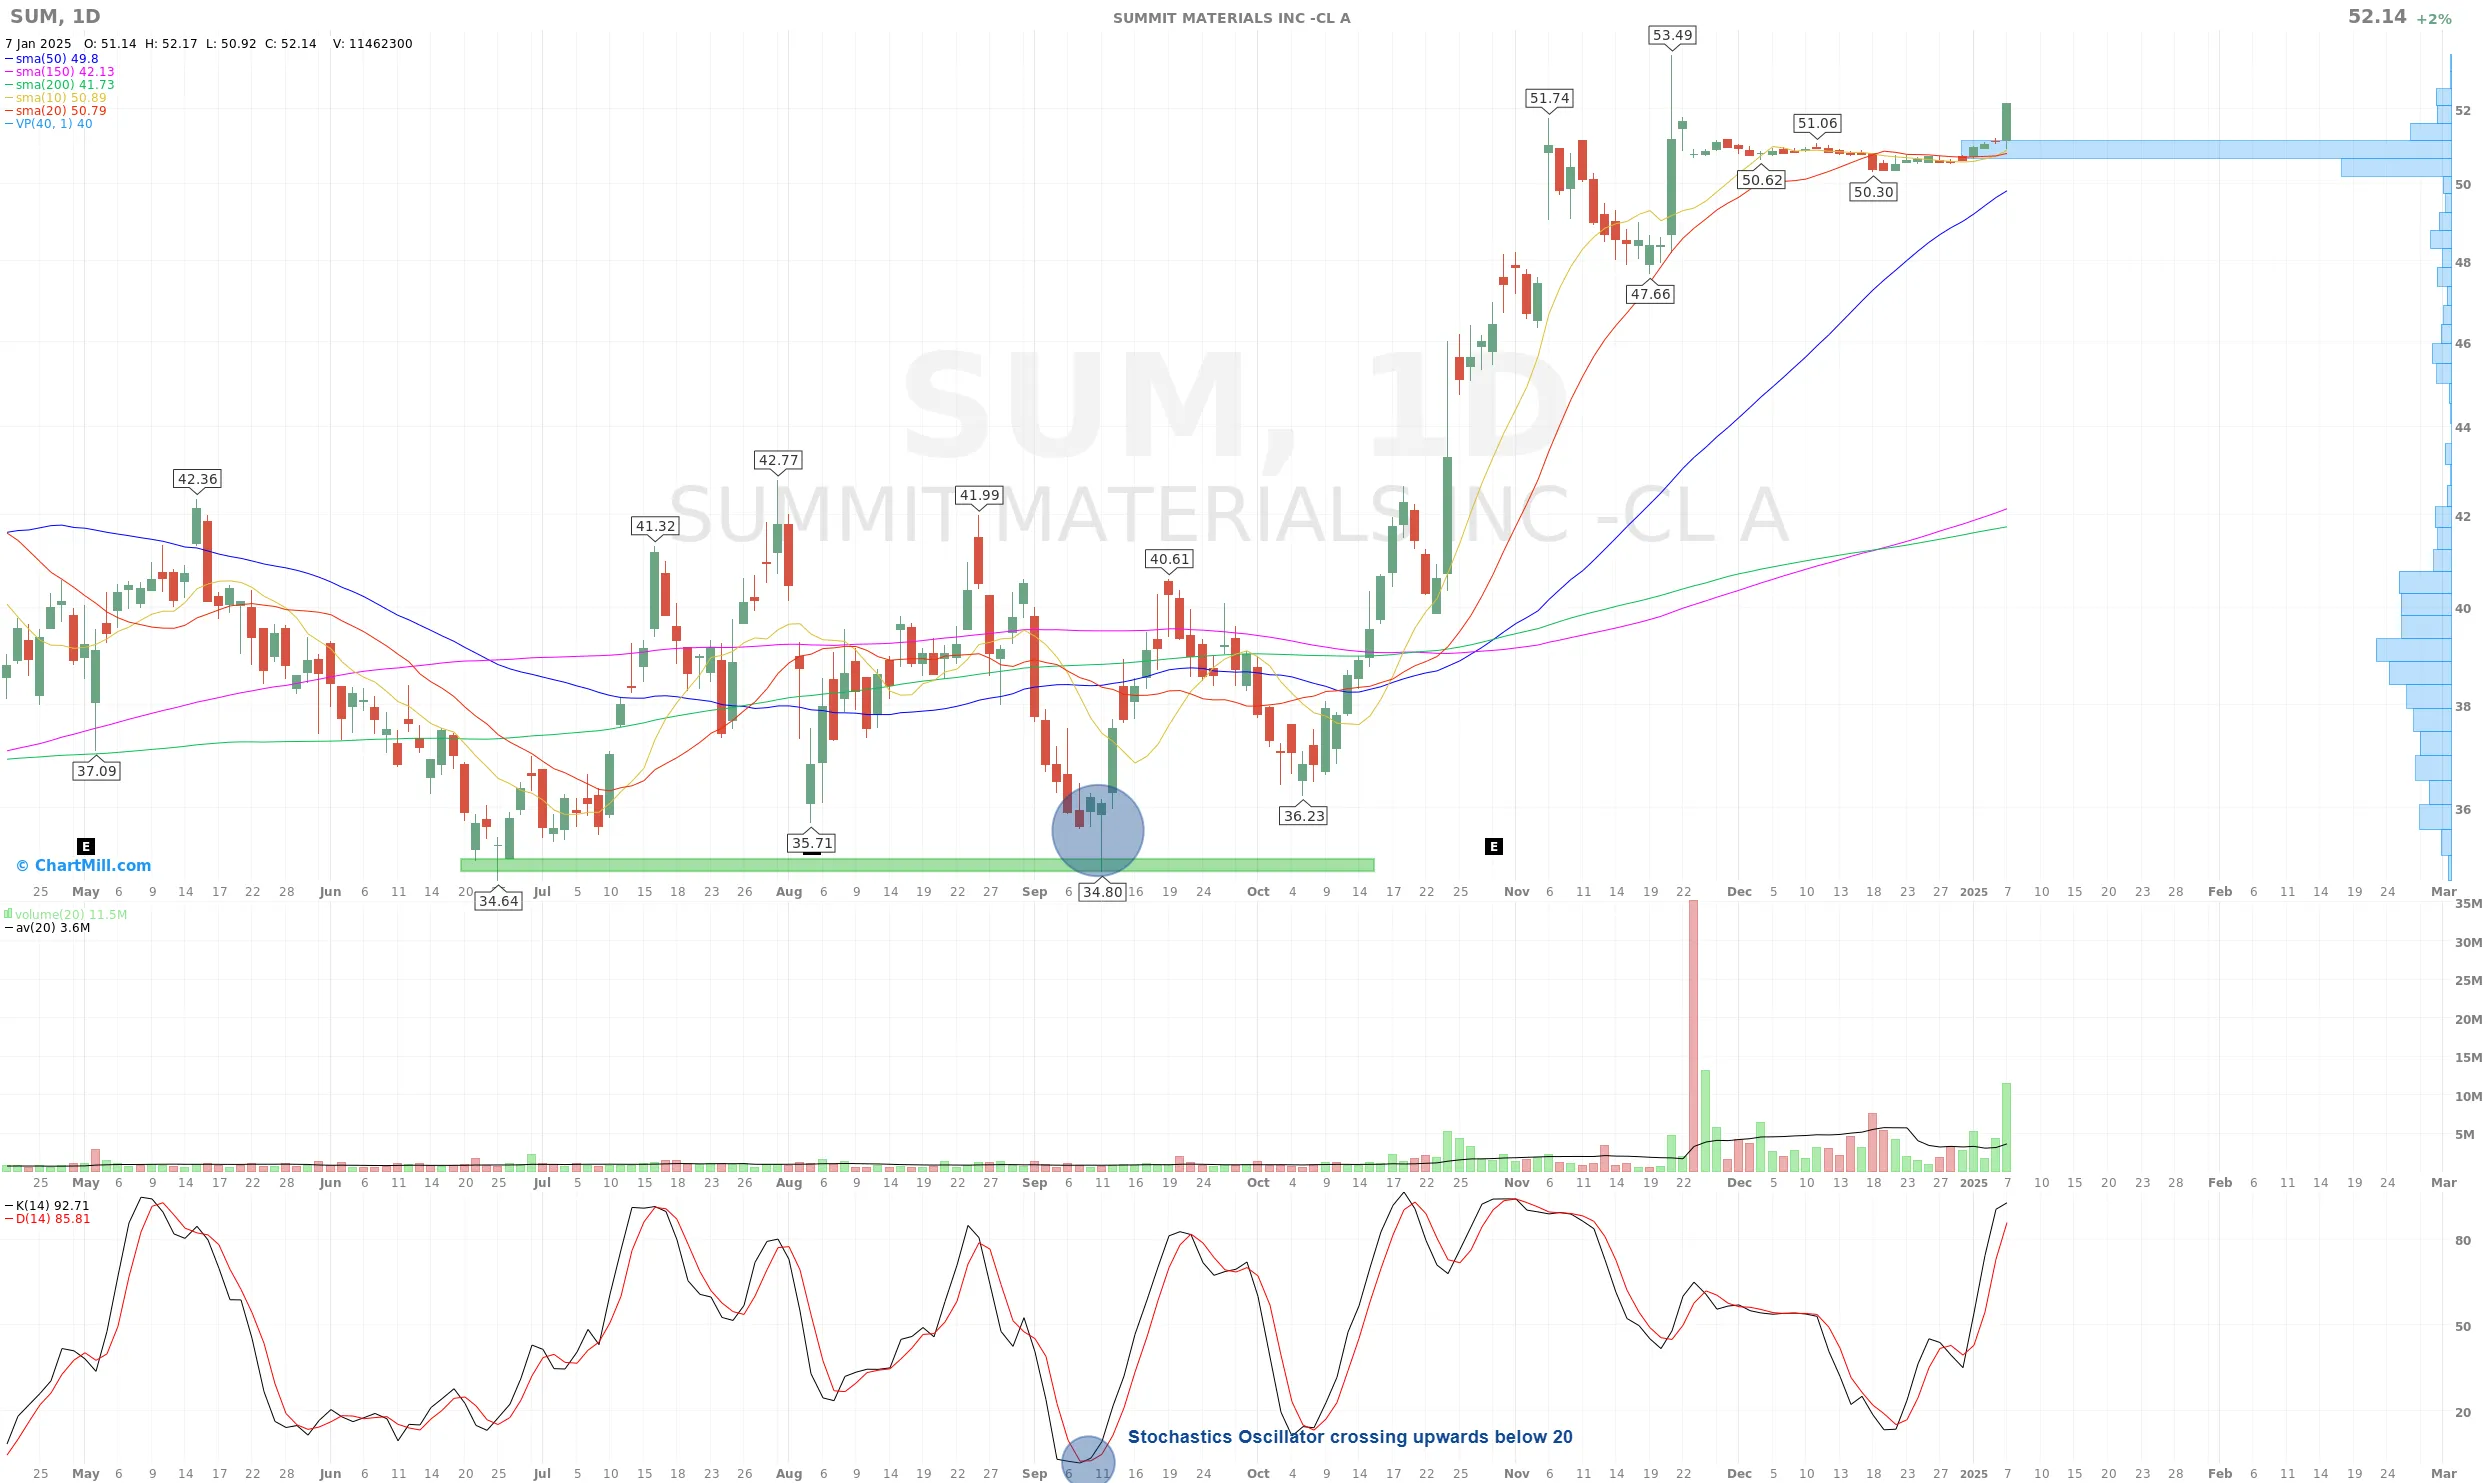
Use with Technical Indicators
The same chart but with the Stochastics Oscillator added.
Just prior to the formation of the Dragonfly Doji candle, an upward cross below the 20-line occurred in the oscillator, a bullish signal indicating a potential reversal move.
Example Trade: Jefferson Financial Group (ticker: JEF)
Chart Type and Timeframe:
- A daily candlestick chart for Jefferies Financial Group (ticker: JEF).
- Shows price movements with candlesticks.
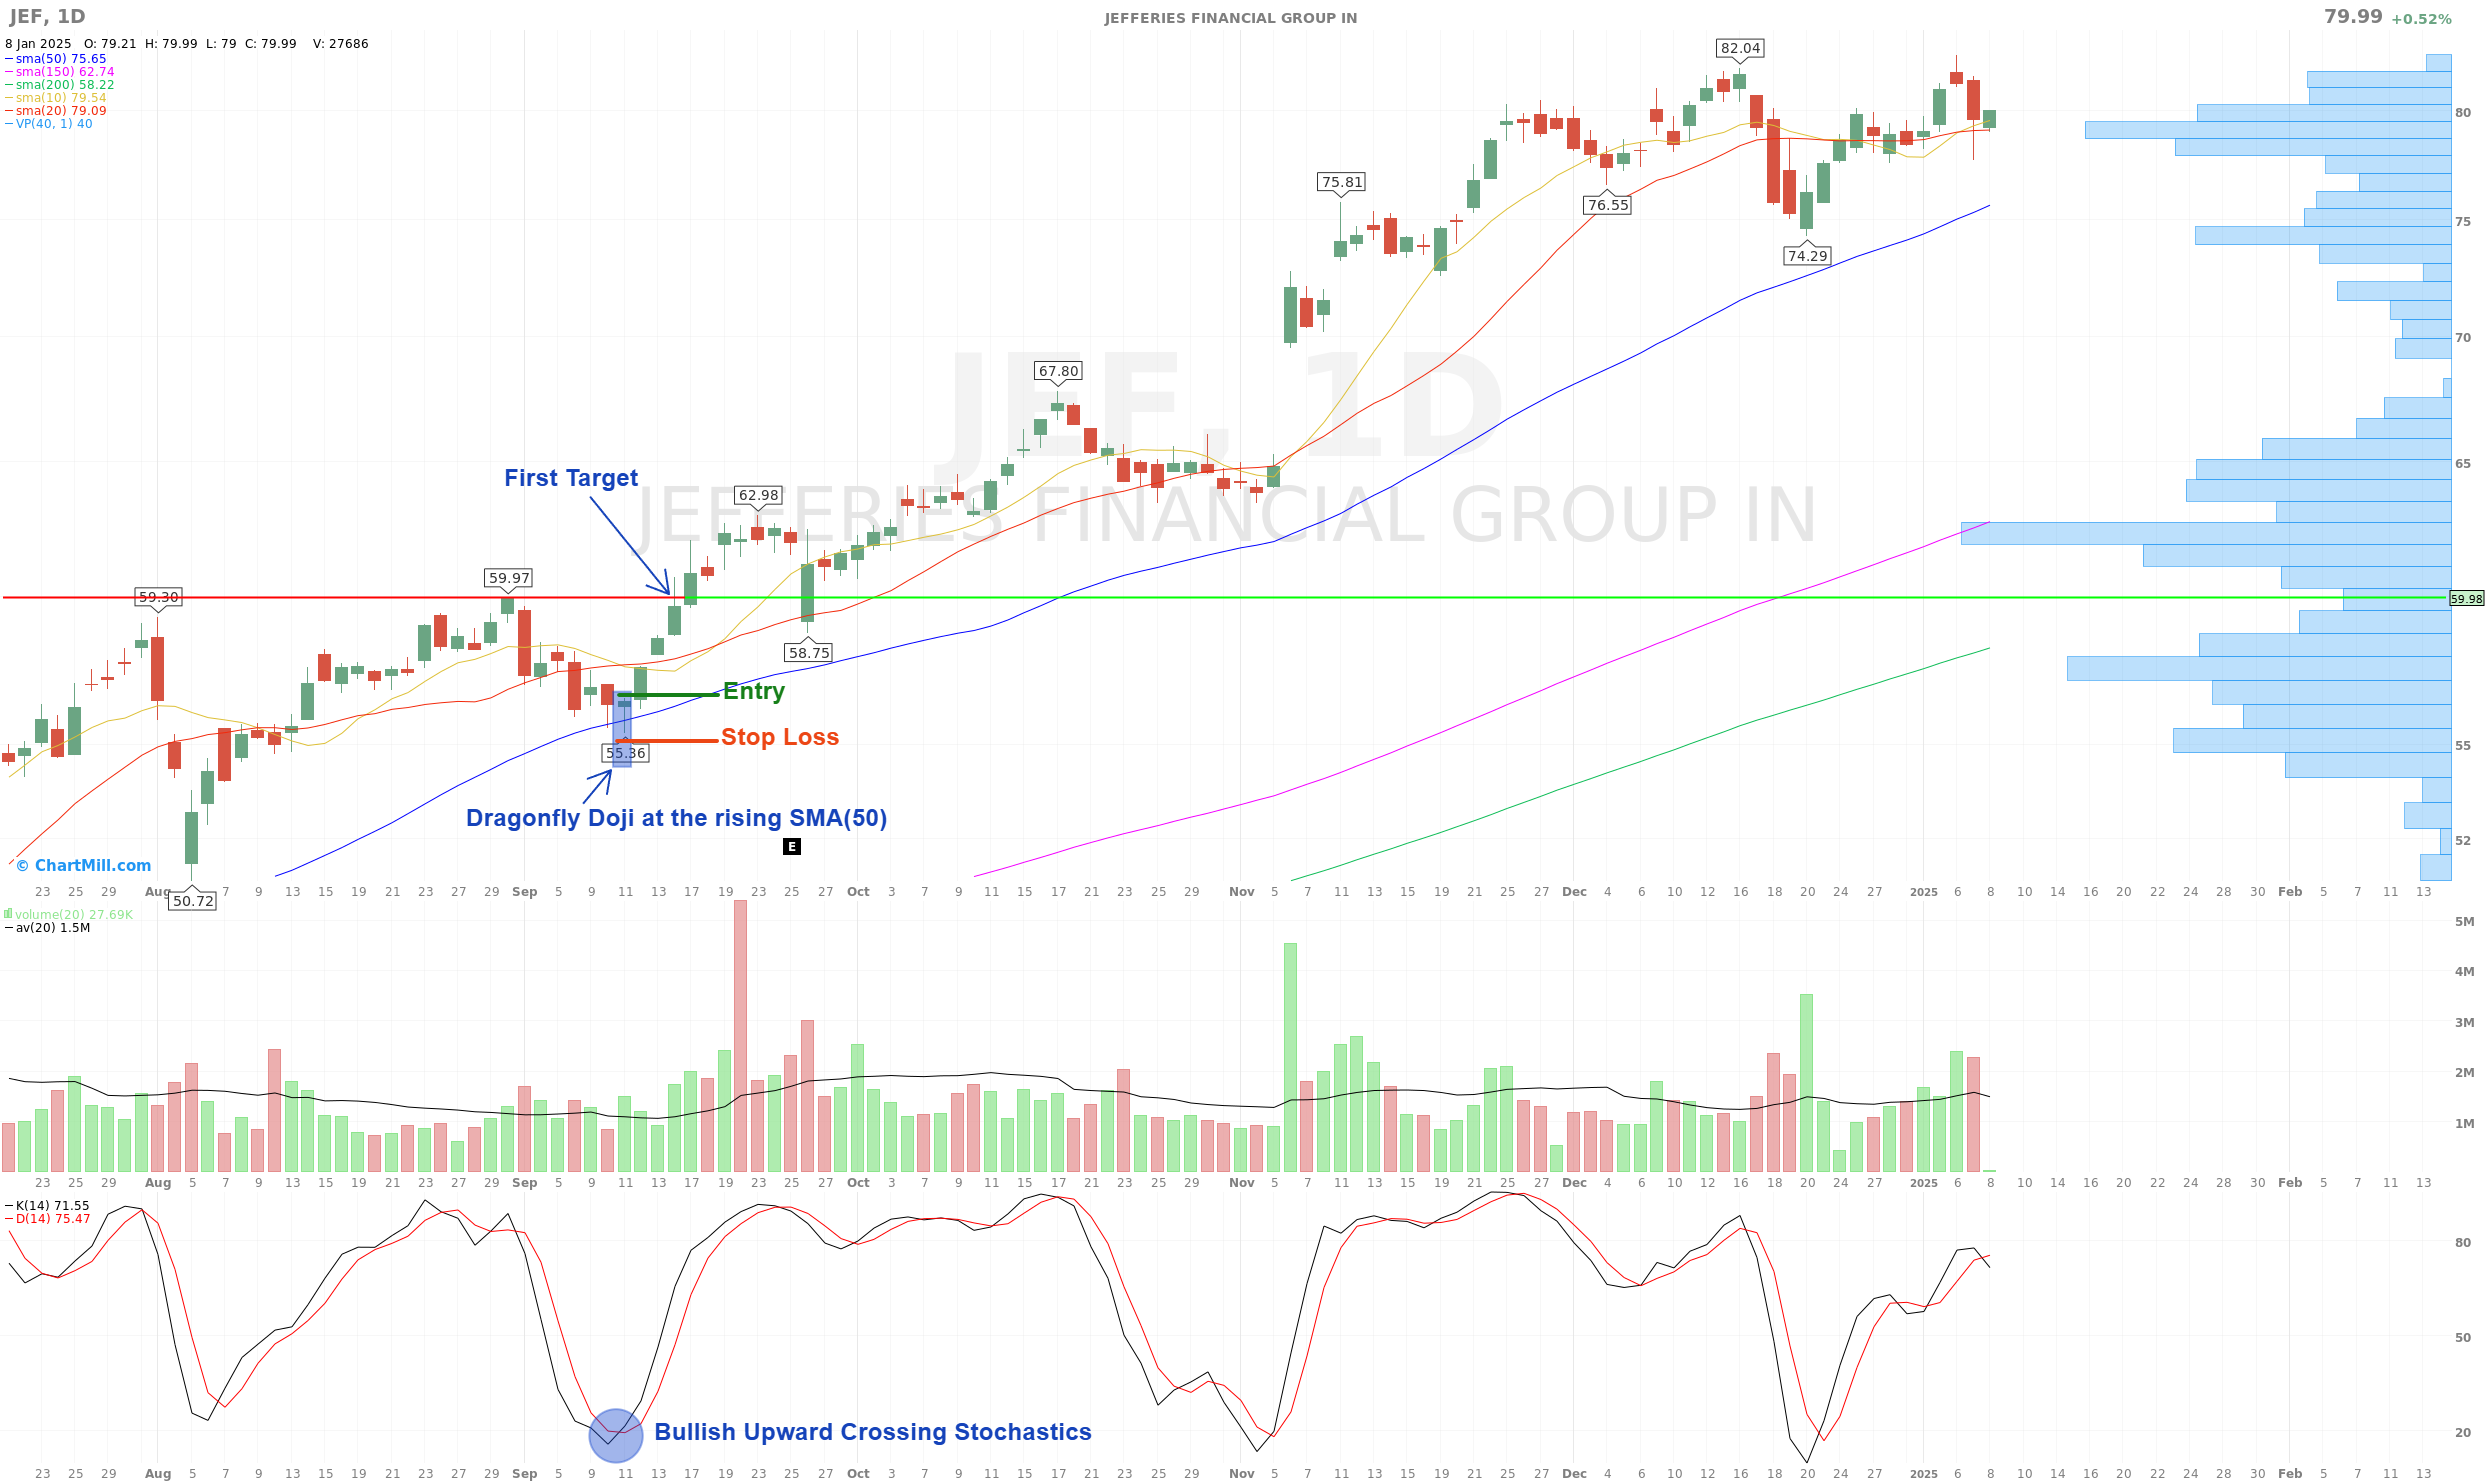
Key Indicators:
Simple Moving Averages (SMA):
- SMA (10) in yellow, SMA(20) in red, SMA(50) in blue, SMA(150) in green, and SMA(200) in magenta.
- These lines show trends over different timeframes.
Stochastics Oscillator:
- Displayed below the chart, with an upward crossover marked as a bullish signal.
Volume Profile:
- Displayed on the right side, showing volume traded at different price levels (horizontal histogram).
Annotated Trading Setup
Dragonfly Doji:
- A Dragonfly Doji candlestick is highlighted at the SMA(50) (blue line). This candlestick signals potential bullish reversal.
Entry, Stop-Loss, and Target:
-
Entry: Marked just above the Dragonfly Doji.
-
Stop Loss: Positioned below the low of the Dragonfly Doji, reducing downside risk.
-
First Target: Marked at $59.97, a horizontal resistance level.
Supporting Bullish Signal:
- The Stochastics Oscillator shows a bullish crossover (highlighted in blue), confirming potential upward momentum.
Trend and Market Context:
The stock is in an uptrend, as indicated by:
- Prices bouncing off the rising SMA(50).
- Higher highs and higher lows visible on the chart.
- Increased volume is visible around the Dragonfly Doji, potentially confirming its significance.
The above chart provides a clear example of a Dragonfly Doji pattern at a rising support level (SMA), supported by bullish confirmation signals, and a planned trade with defined risk (stop-loss) and reward (target).
While the Dragonfly Doji is a powerful candlestick pattern that can signal potential reversals, it is important to emphasize that these patterns do not guarantee a certain outcome.
No trading setup is foolproof, and market conditions can sometimes invalidate even the most reliable signals. Losing positions are an inevitable part of trading, and this setup is no exception.
The key to long-term success lies in proper risk management, such as using stop-loss levels to limit downside risk and maintaining a disciplined approach.
Be sure to read this article to fully understand the importance of proper risk management: "Swing Trading Risk Management: Navigating the volatile waters of trading."
Always remember that patterns like the Dragonfly Doji should be used in conjunction with other indicators and broader market analysis to improve the probability of success.
What Does the Absence of an Upper Shadow in "a Dragonfly Doji Candle" Mean?
The absence of an upper shadow in a Dragonfly Doji holds significance due to its implications for market sentiment.
When there is no upper shadow or an extremely short one, it suggests that the high price reached during the session was maintained until the close. This indicates a strong bullish momentum, as buyers were able to push the price up and keep it elevated, without allowing sellers to regain control.
It reinforces the notion that buyers have a firm grip on the market, potentially signaling a trend reversal or a continuation of an upward move.
Dragonfly vs Gravestone: What's The Difference?
For both patterns, both the open, high and close are approximately at the same level. The difference between the two patterns is the location of the shadow.
For the Dragonfly doji, it is visible as a long lower shadow. For the Gravestone doji, there is a long upper shadow.
Both patterns suggest a trend change. One speaks of a dragonfly when the trend change goes from bearish to neutral to bullish. Otherwise, when the trend seems to reverse from bullish to neutral/bearish, it is called a gravestone pattern.
Other Doji Candlestick Chart Patterns
Understanding the Gravestone : A Bearish Reversal Warning Signal in Trading
The gravestone doji candle pattern is considered a bearish reversal signal in a bullish trend. More details
