
Kristjan Kullamägi Continuation Breakout Screen
In this article I share a day/swing trading screen you can use to find the "Continuation Base Breakouts" of Swedish swing trading genius Kristjan Kullamägi.
After blowing up several small accounts of a few $1000 early in his career (2011-2012) he eventually managed to become structurally profitable. Tight risk management and clear entry and exit rules made the difference. He also switched from day trading to swing trading because that's where the really big moves could be found.
His view of financial markets
Bull markets are always characterized by the same process that repeats itself over and over again. It goes as follows; The stock breaks out of a long base, the price rises significantly after which a sideways movement or a slight decline follows.
This is followed by another breakout where the price continues to rise.
As a trader, you can profit from this if you :
-
are able to recognize the beginning of the breakout phase and the subsequent first upward move,
-
can identify the point at which there is a significant probability that the rise will continue. This is called the pivot or breakout point, the price level at which a long position can be taken to anticipate the next upward movement.
Point 1 is fairly easy to identify because its main feature is the strong price appreciation with a lot of momentum on a relatively short term.
The exact pivot point can be recognized from various chart patterns that can be divided into four types:
- (High Tight) Flag
- Cup & Handle
- Triangle/Wedge
- rectangle box
These four patterns are the starting point for entering the market. To do so, he uses three different setups:
- The continuation Base Breakout
- The Gap Up Base Breakout (he uses the name Episodic Pivot for this). More info in this separate article
- The Parabolic Long/Short
We will stick to the first method in this article, as it is most closely related to the swing trading approach. More information on setups 2 and 3 can be found on his website.
Before dissecting the 'Continuation Base Breakout' in more detail, we must first and foremost have a base list of stocks that meet the above price characteristics and where the probability of a subsequent price rise is present.
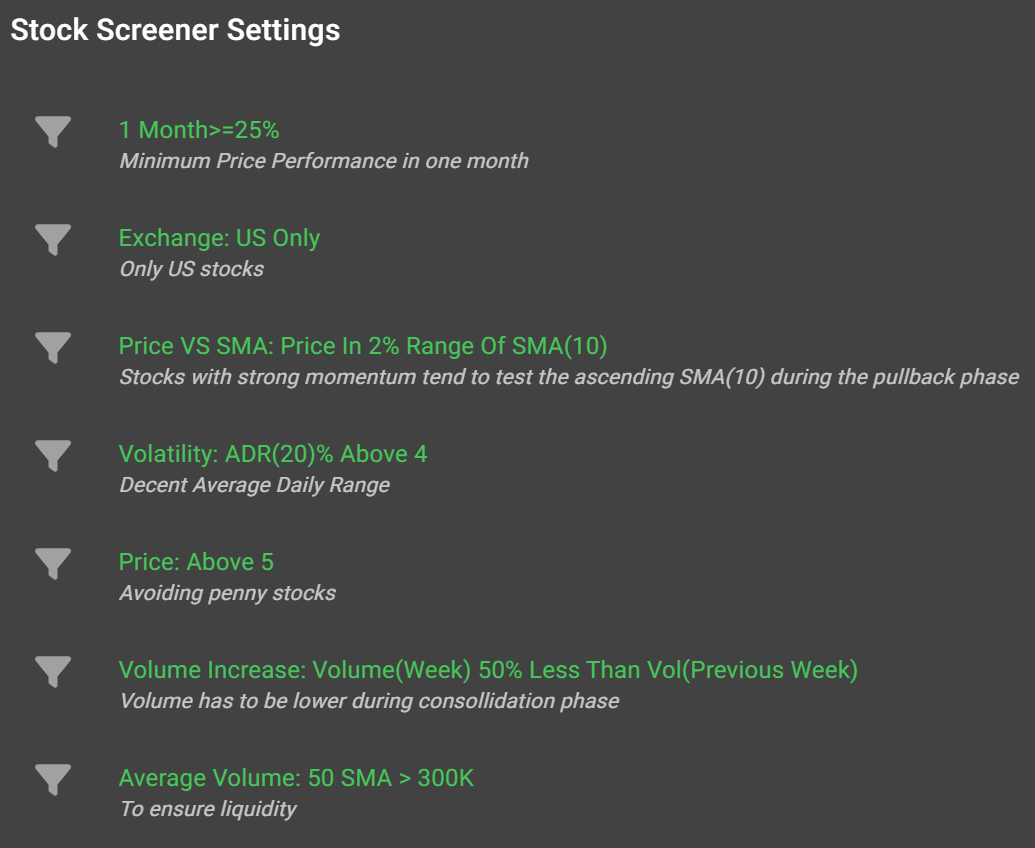
That's where ChartMill comes in. Using the filters below, you can quickly arrive at a basic list of stocks that have risen rapidly in a relatively short period of time and where the price is currently close to the SMA(10).
The minimum price of $5 and the applied minimum daily volume of 300,000 shares, ensure that the selected stocks are sufficiently liquid so that buying and selling never becomes a problem.
This a direct link to the pre-build trading idea in ChartMill
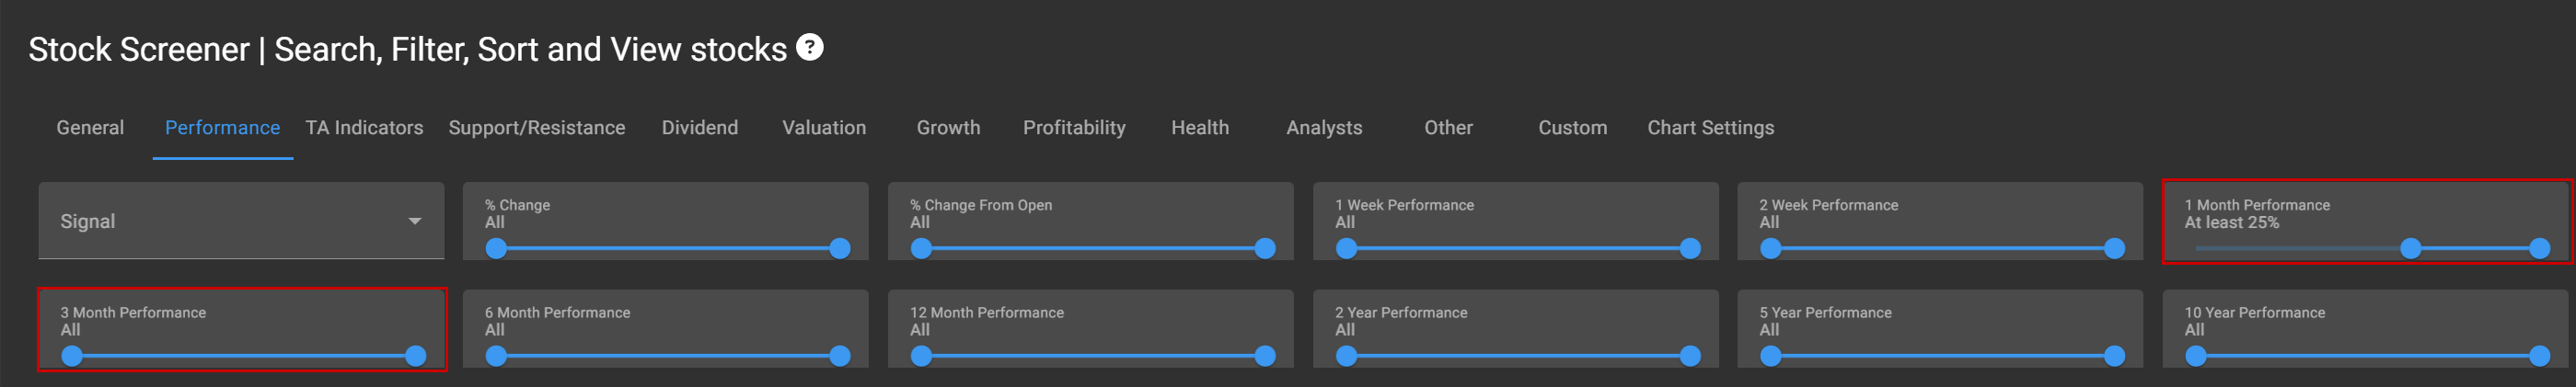
@cullamaggie screens on different time periods (1-3 months) and using different percentages (25-100%) for that first notable price increase. This is also possible with the predefined trading idea by using the 'Performance' menu to change the time period and the corresponding percentage increase after which you can then check the results.
His exact entry and exit rules can be found on his website by following this link.
Some results for this screen
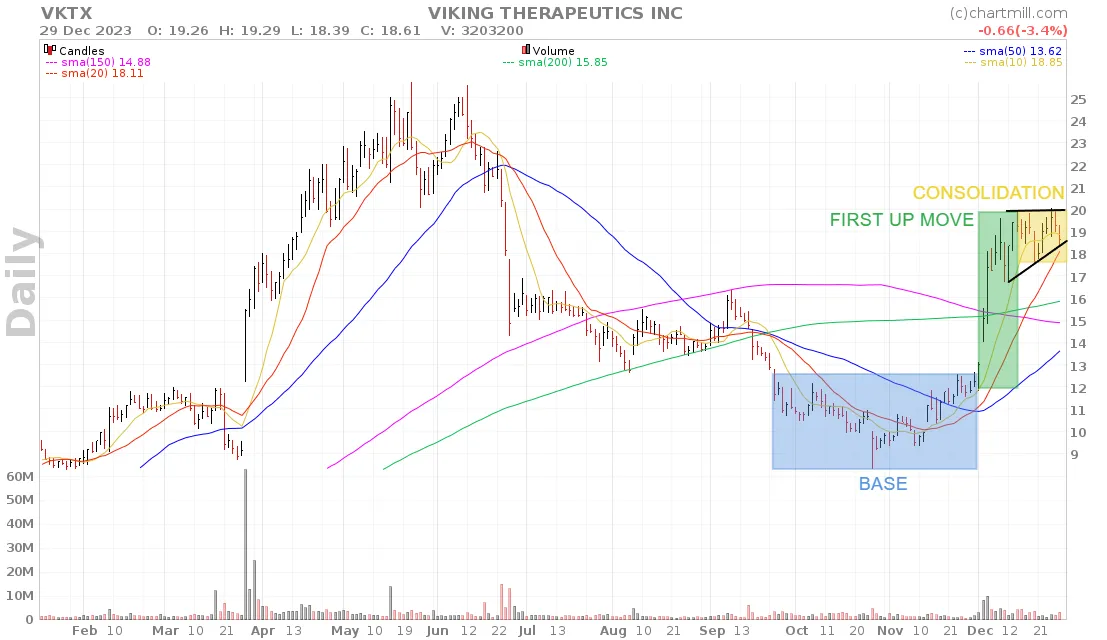
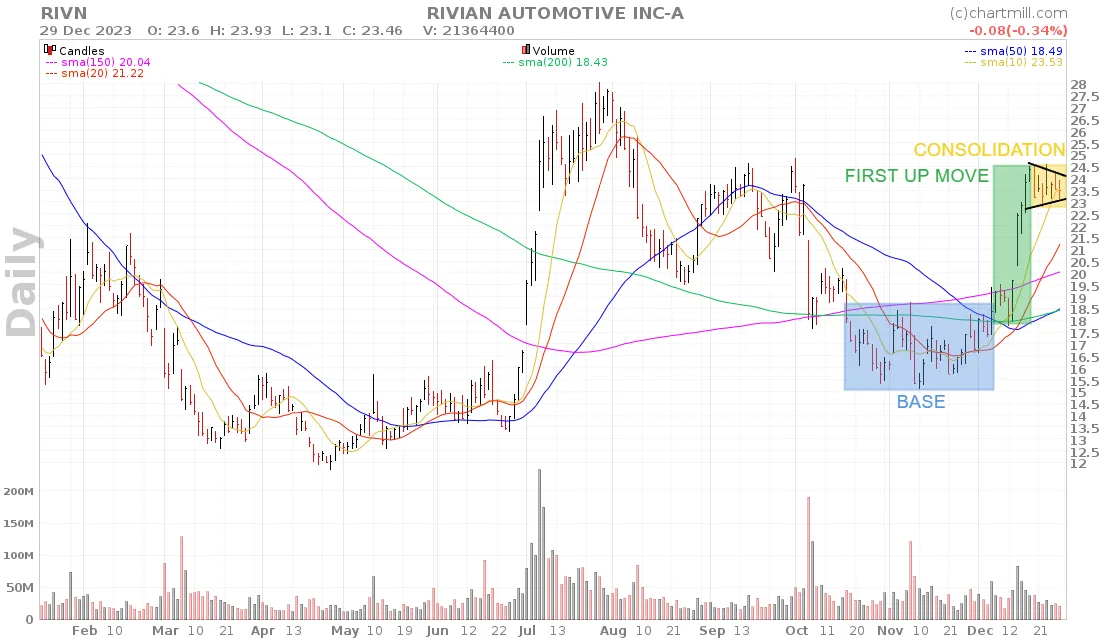
Of course, not all results from this screen qualify, but this pre-established screen is certainly capable of generating high-quality, low-risk setups.
Here are a few screenshots of results that have recently popped out the screener.
Base Breakout Trading Example
The example below is a trade that - at the time of writing this article - I am still monitoring live via the demo live forward test portfolio on my Twitter page. The setup was announced on date of 12/05/2023 but it took until 12/11/2023 to reach the entry price.
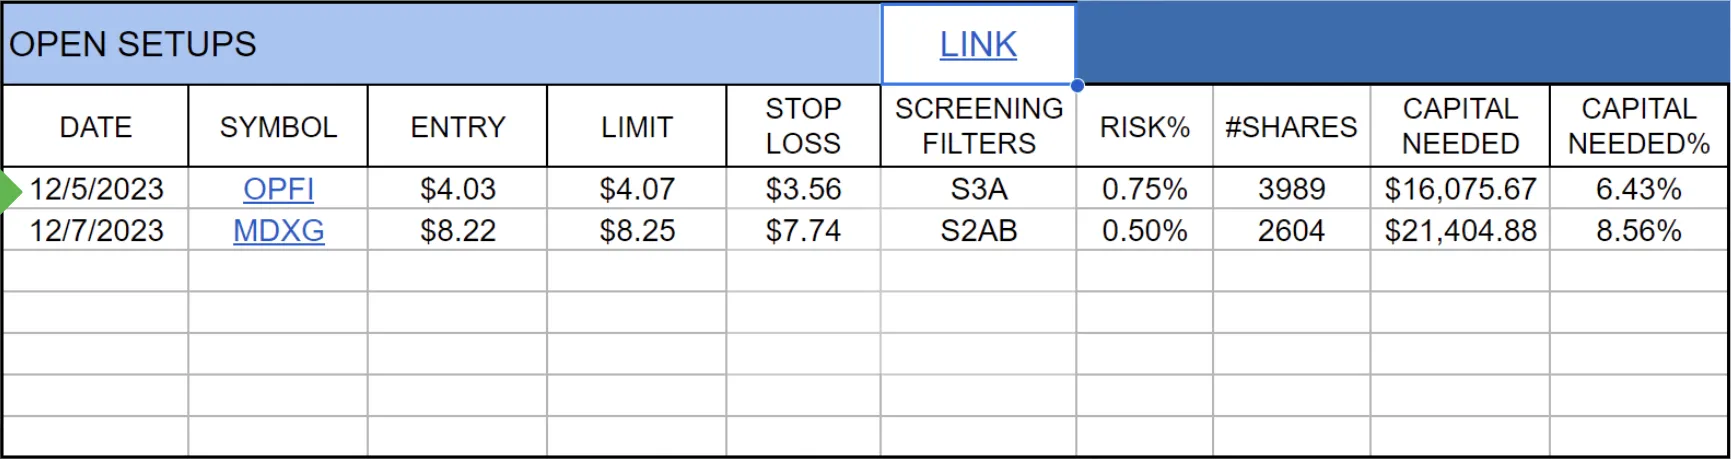
The setup met the Base Breakout conditions perfectly:
- A breakout from a base formation (blue block)
- A first strong rise in a short period of time with sharply increased volume (first green block),
- Price moving sideways with higher swing lows in a rising triangle pattern (yellow block)
- The Pivot point just above it and the breakout as the start of the continuation Base Breakout
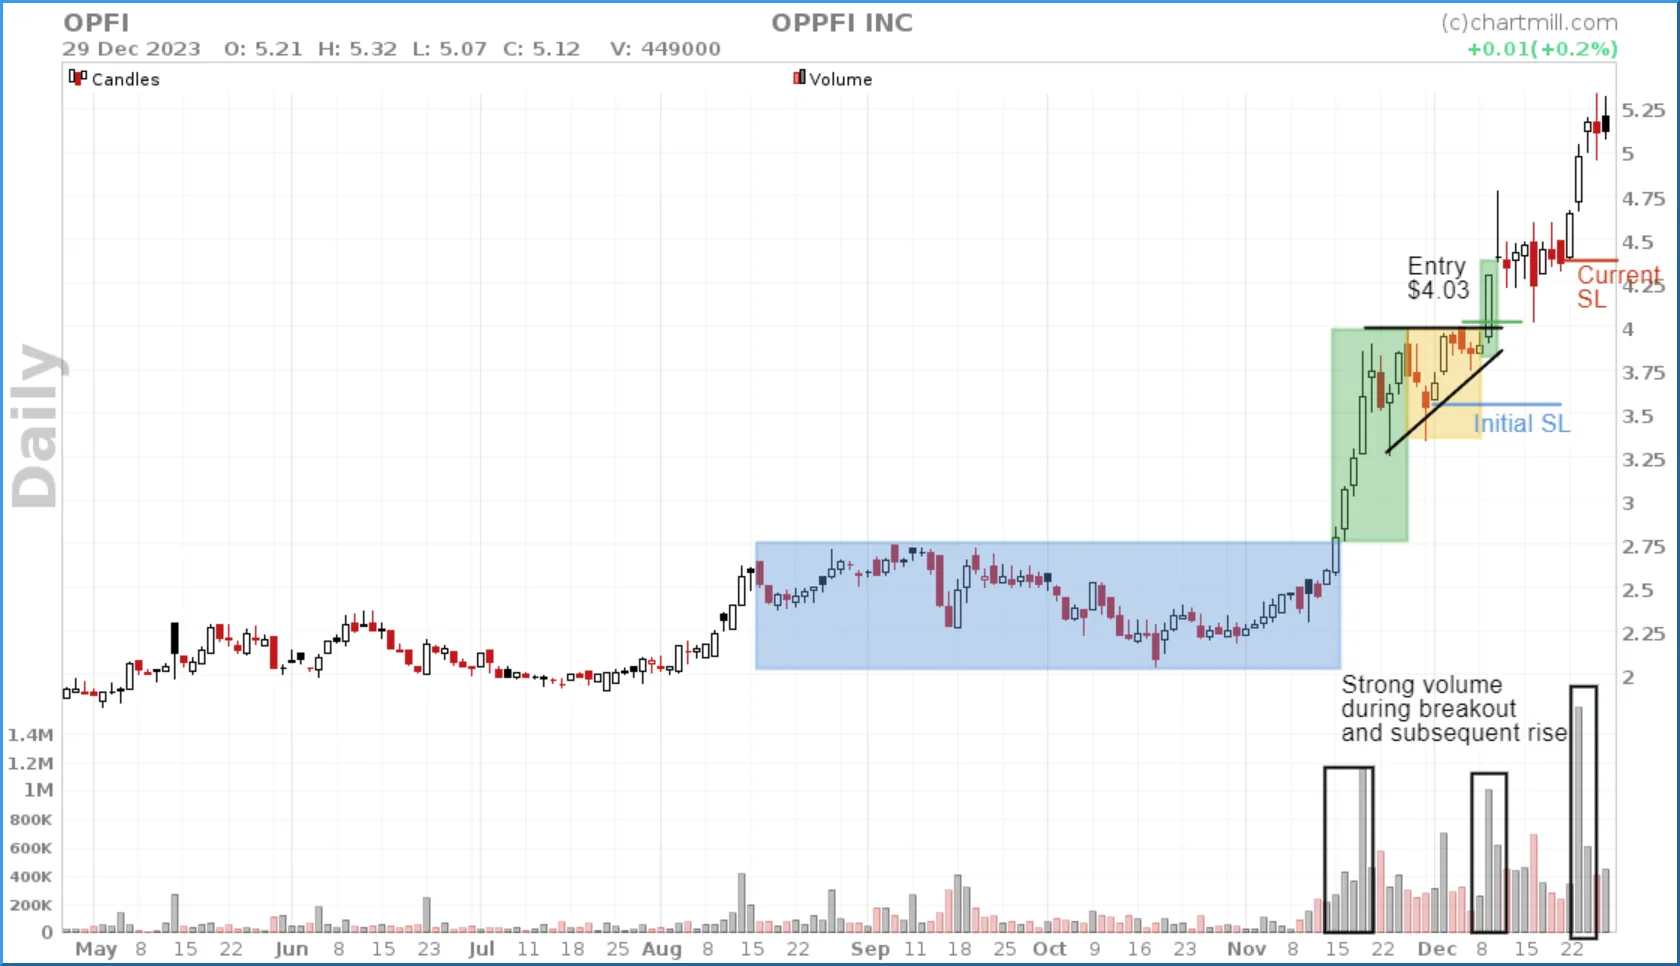
The current stoploss for the entire position is already in profit. A sell order was placed for half of the position on date of 12/29/2023 (EOD) at $6.5.
Daily updates after market close for this demo portfolio* can be followed via my twitter page.
Happy Screening!
Kristoff - ChartMill
*The demo portfolio is a virtual paper trading portfolio used exclusively to test the various setups coming from the pre-built trading ideas in ChartMill that focus on swing trading.