
Annotation Tool
By Aldwin Keppens - reviewed by Kristoff De Turck
– Last update:
In Chartmill there is a possibility to easily annotate your charts. This can be done both in the stock charts section as in the stock screener section on our website.
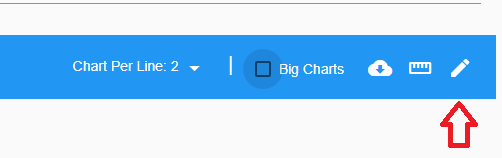
To start, make sure you have displayed at least one chart on your screen in the stock charts or screener output. Once you have results, you can click the "crayon-icon" in the results header bar:
After clicking, the annotation bar will now appear on top of the screen.
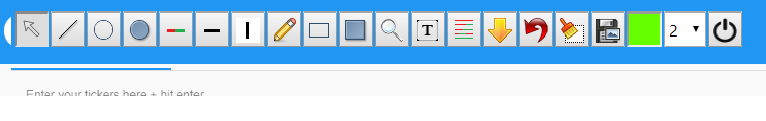
Finally, select a tool and click in the chart to start annotating!
A quick overview of all available tools:
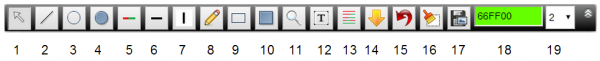
- Selection tool.
- Draw a line.
- Draw a (transparant) Circle
- Draw a (transparant) filled Circle
- Horizontal line that changes color depending support/resistance.
- Horizontal line
- Vertical line
- Free draw
- Draw a (transparant) rectangle
- Draw a (transparant) filled rectangle
- Inspect: shows precise OHLC for each candle on hover
- Text annotation.
- Fibonacci retracement lines.
- Arrow.
- Undo.
- Clear all.
- Save to computer.18 Color picker.
- Color picker. This can be used with each drawing action.
- Border thickness of annotations.