
For investors looking for chances where a company's market price may not completely show its basic business quality, a careful value investing method can be a practical structure. This method means finding stocks that seem priced below their worth based on core measures, such as earnings, cash flow, and financial condition, while also showing good operational results. By concentrating on companies with good profit generation and acceptable debt that are selling at sensible prices, investors try to find possible chances where a buffer exists.
ZEBRA TECHNOLOGIES CORP-CL A (NASDAQ:ZBRA) is a company that recently appeared from a filter made to find such "acceptable value" chances. The filter specifically searched for stocks with a good basic valuation score, along with acceptable scores in profit generation, financial condition, and expansion. A more detailed look at Zebra Technologies' basics indicates it may deserve more attention from investors using this kind of method.
Valuation: An Interesting Entry Point
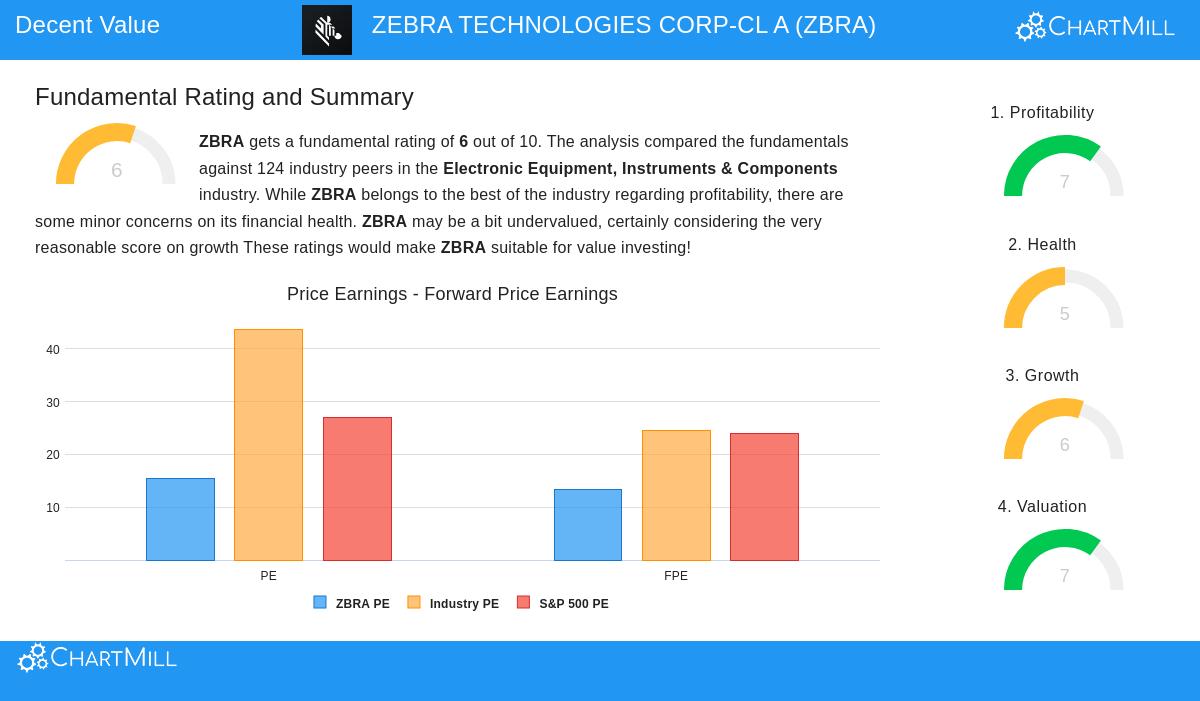
The central idea of value investing is buying a dollar's worth of assets for clearly less than a dollar. Zebra Technologies' valuation measures indicate the market may be pricing the company cautiously. According to ChartMill's basic study, the stock gets a Valuation Score of 7 out of 10.
- Price-to-Earnings (P/E): At 15.39, Zebra's P/E ratio is seen as showing a fair price for the company. Yet, this number becomes more interesting in comparison. It is valued less expensively than 86% of similar companies in the Electronic Equipment, Instruments & Components industry, where the average P/E is much higher at 43.7. It also sells at a lower price than the wider S&P 500's average P/E of 26.94.
- Forward P/E and Cash Flow: The future-looking measures make the argument stronger. With a Price/Forward Earnings ratio of 13.32, the stock is less costly than about 89% of its industry rivals. Also, its Price/Free Cash Flow ratio is more appealing than almost 89% of the industry, showing the market is paying a relatively small amount for the company's cash production.
This mix of fair absolute ratios and appealing relative price compared to both its field and the wider market matches the value investor's aim of finding below-value chances.
Profitability: A Base of Operational Quality
A below-value stock is only a sound investment if the basic business is solid. A company with poor or falling profits might be inexpensive for a cause, a known "value trap." Zebra Technologies shows solid operational condition, getting a Profitability Score of 7. Its profit margins and returns are a specific quality.
- Good Margins: The company keeps a Gross Margin of 48.4% and an Operating Margin of 15.3%, putting it in the high group of its industry and doing better than over 80% of similar companies. This shows price control and effective cost handling.
- Effective Use of Capital: Zebra's Return on Invested Capital (ROIC) of 10.7% is very good for its industry, doing better than 87% of rivals. Its three-year average ROIC of 11.6% also rests well above the industry average of 8.8%. These measures suggest management is successfully using capital to create profits.
For a value investor, this degree of profit generation gives assurance that the business is basically in good condition and that the current price may not be showing its earning ability.
Financial Condition: A Mixed Review
Financial condition is important for surviving economic declines and avoiding high risk from debt. Zebra Technologies gets a Condition Score of 5, showing a varied but generally okay view. The study points out both qualities and points to watch.
- Solvency is Positive: The company's debt level seems acceptable. Its Debt to Free Cash Flow ratio of 2.74 is considered sound, meaning it would take under three years of current cash flow to pay all debt, a number better than 72% of the industry. Its Altman-Z score of 3.71 shows no near-term bankruptcy danger.
- Liquidity and Leverage Points: The report states that Zebra's Current and Quick ratios, while enough to meet near-term needs, are in the lower part of its industry. Its Debt/Equity ratio of 0.56 shows some use of debt financing and is less positive than about 76% of similar companies.
While not perfect, the condition picture shows a company with a lasting capital setup and acceptable debt, which is a key point to avoid the problems of high-debt businesses.
Growth: A Future Catalyst
Pure value stocks can sometimes be slow. The addition of an expansion part in the filter helps find companies with possible reasons for price increase. Zebra Technologies gets a Growth Score of 6, showing positive movement.
- Recent and Projected Increase: The company reported good recent expansion, with Earnings Per Share (EPS) up 38.2% and Revenue up 12.9% over the last year. More significantly, the expansion rate is projected to increase. Experts forecast EPS to expand almost 14% each year in the next few years, moving faster than the small expansion of the past five years.
- Valuation and Growth Combined: This projected expansion is a key element. The stock's low PEG ratio (which includes expansion in the P/E) shows its price is inexpensive even when considering its future earnings potential. This mix of fair price and positive expansion path is what value-focused growth investors often look for.
Conclusion and Next Steps
Zebra Technologies shows a picture that matches several ideas of value investing: it seems to sell at a lower price than its industry and the market, it is based on a foundation of good profit generation and acceptable financial condition, and it is showing an increasing expansion picture. This mix tries to give the "buffer" that value investors value, while the expansion part offers a possible way for market re-pricing.
It is important to state that the company's financial condition has some detailed parts, especially about liquidity measures, which need notice. Also, as a supplier of automatic identification and data capture tools, its results are linked to business investment spending cycles.
For investors wanting to study similar chances that fit this mix of valuation, profit generation, condition, and expansion rules, you can see the full basic study report for ZBRA here. Also, to filter for other stocks that match this "acceptable value" picture, you can use this set Acceptable Value Stocks filter.
,
Disclaimer: This article is for information only and does not make financial guidance, a suggestion, or an offer or request to buy or sell any securities. The information given is based on supplied data and should not be the only base for any investment choice. Investing includes risk, including the possible loss of original money. Always do your own study and think about talking with a skilled financial consultant before making any investment choices.