
For investors looking to find stocks ready for their next rise, a frequent technical method centers on securities that are in a firm upward trend and also settling in a narrow price band. This method tries to seize momentum by taking a position as the stock moves out of this settling phase, preferably with specific risk limits. One instrument that measures these situations is the ChartMill Technical Breakout Setups screen, which selects for stocks with a high Technical Rating, pointing to firm basic trend health, and a high Setup Quality Rating, meaning a helpful, steady price formation that might come before a breakout.
A recent search using this process has pointed to EXXON MOBIL CORP (NYSE:XOM) as a choice showing these traits. The large energy company, with its wide activities across exploration, production, and petrochemicals, is now showing a price chart formation that might interest traders focused on technicals.
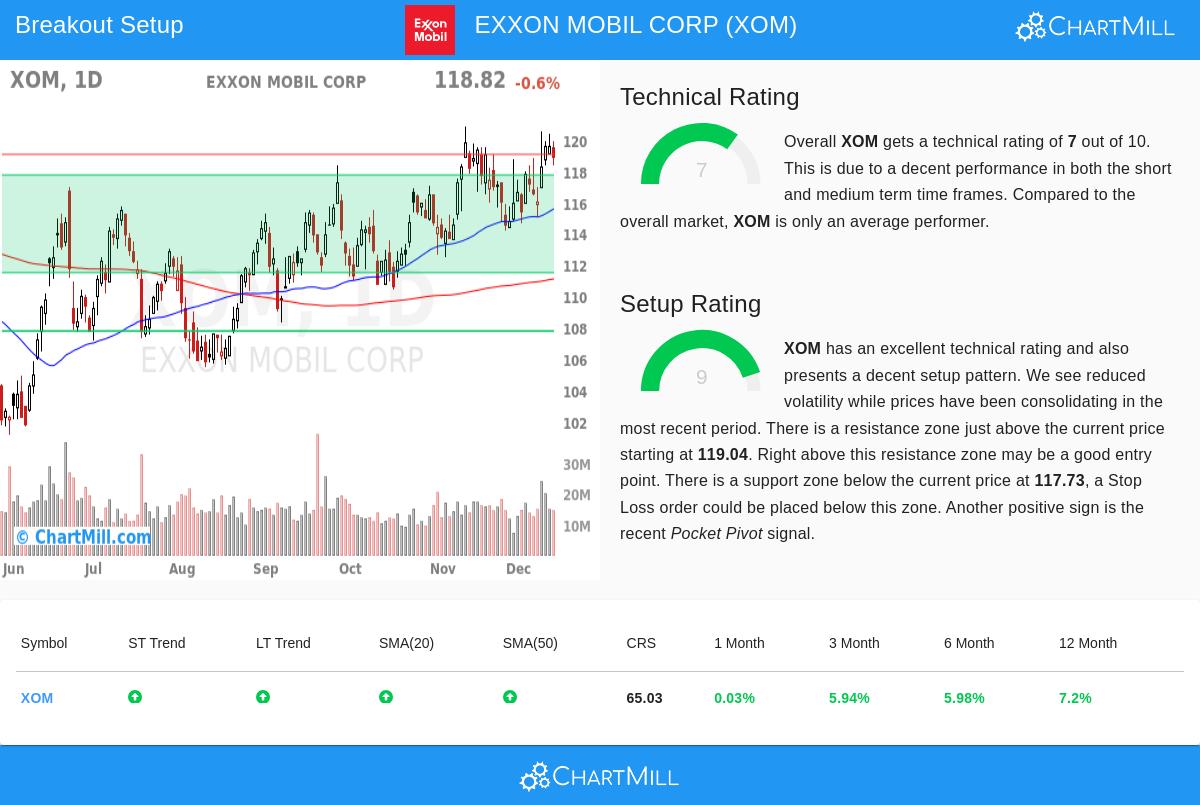
Looking at the Technical Health
The base of a possible breakout trade is a stock's basic condition and directional tendency. Exxon Mobil's ChartMill Technical Report gives it a firm Technical Rating of 7 out of 10. This number combines several trend and momentum parts, and a rating over 7 usually means a stock is in a clear uptrend. The report lists a few good technical points backing this rating:
- Trend Direction: Both the near-term and longer-term trends for XOM are marked as up. This agreement across different periods is a solid positive sign, hinting at continued buyer interest.
- Place Compared to Important Averages: The stock is priced above all its main simple moving averages (20, 50, 100, and 200-day), and each of these averages is also in an upward path. This arrangement shows an uptrend with good backing.
- Performance Compared to the Market: XOM is trading close to its 52-week peak. While its relative strength number shows it is a middling performer next to the wider market and other energy companies, holding firm while the S&P 500 is also at peaks indicates it is moving with the general positive market tone.
This mix of elements is key for the breakout method. A high Technical Rating aids in selecting for "market front-runners" or stocks with firm momentum, raising the chance that a breakout from settling will result in a further move up instead of a failed signal.
Judging the Setup Condition
While a firm trend is needed, it is not enough for a best entry. A stock that has risen sharply may be stretched and likely to decline. This is where the Setup Quality Rating becomes important, as it finds times of settling or pause inside the wider trend. Exxon Mobil does well here, having a high Setup Rating of 9 out of 10.
This very good number shows a price chart that has been "narrowing" or trading in a small band, which frequently comes before a clear move in one direction. Main points from the report are:
- Latest Price Movement: During the last month, XOM has traded in a limited band between about $114.19 and $120.47. This lessened movement and sideways action lets moving averages adjust and forms a base of support.
- Specific Support and Resistance: The study finds a clear support area below the present price (from $111.51 to $117.73) and a close resistance area (from $119.04 to $121.37). These specific levels are necessary for organizing trade entry, exit, and risk control.
- Supportive Signs: The report also mentions a recent "Pocket Pivot" signal, a volume-related indicator that can point to buying by large investors during the settling stage, giving another layer of support to the setup.
The high Setup Rating speaks directly to the "when to buy" question of the method. It shows that XOM is not stretched but is instead tightening inside its uptrend, possibly preparing for a breakout if it can gather the volume to move past the above resistance.
A Possible Trade Plan
Built on this technical and setup study, the ChartMill report describes a sample trade setup. It proposes a possible entry point just above the noted resistance area at $121.38, with a stop-loss order set below the recent band at $114.68. This plan would set the trade's risk at about 5.5% from entry to stop. It is very important to know this is an automatic example for learning, not advice. Traders should always do their own study, change levels to match their own risk comfort, and know about basic elements like future earnings announcements.
Locating Other Chances
The technical setup now seen in Exxon Mobil is not alone. The ChartMill Technical Breakout Setups screen is updated each day to find new choices that meet these strict needs of firm trends and good-quality settling periods. You can see the present list of possible breakout setups by going to the Technical Breakout Setups analyzer.
Disclaimer: This article is for information and learning only and is not investment advice, a suggestion, or an offer or request to buy or sell any securities. The study is based on technical data and automatic reports. All investing and trading has risk, including the chance of losing the original investment. Past results do not guarantee future outcomes. Readers must do their own research and talk with a qualified financial advisor before making any investment choices.