
For technical investors aiming to find stocks ready for their next advance, a frequent method uses two main parts: a solid core trend and a positive price pause. The aim is to discover leading stocks that are resting after a good move, preparing for a possible rise. This method is measured by the ChartMill Technical Rating, which assesses the general condition and trend force of a stock, and the Chartmill Setup Quality Rating, which judges the state of a current pause pattern. A stock with high marks on both measures can offer a notable technical picture.
EXXON MOBIL CORP (NYSE:XOM) is now a clear example of this method working, showing on a search for technical rise preparations. The large energy company, with its wide work in exploration, production, and petrochemicals, is showing a strong technical picture that calls for more study from traders focused on charts.
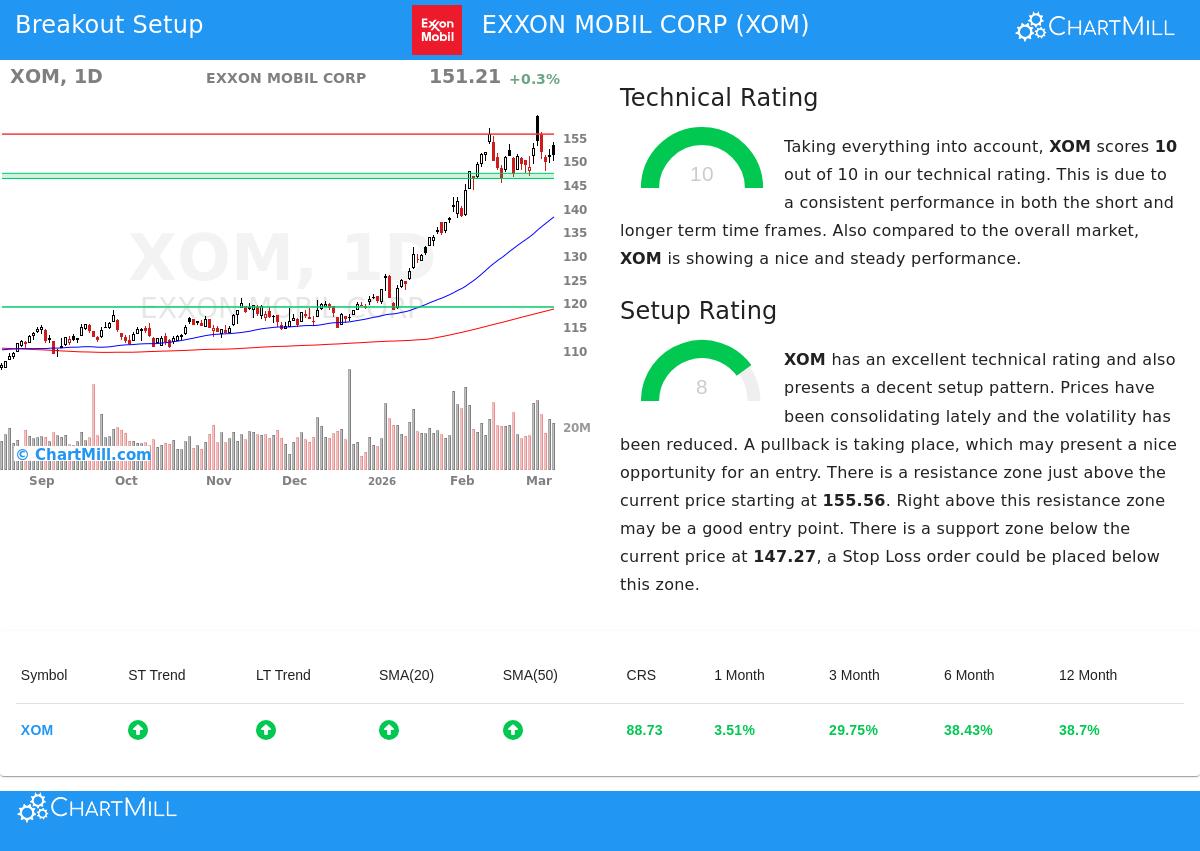
Technical Force: The Base of the Trend
The first part of a good rise setup is a solid and confirmed upward trend. This is key because it raises the chance that any move from a pause will keep going in the current direction of the market's force. Exxon Mobil does very well here, having a complete ChartMill Technical Rating of 10. This highest mark shows notable force across many time periods and technical areas.
A full look at the technical report shows the reasons for this high rating:
- Trend Agreement: Both the near-term and long-term trends for XOM are marked as good. This agreement across time periods is a strong positive sign, showing steady buying activity.
- Moving Average Backing: The stock price is above all its main simple moving averages (20, 50, 100, and 200-day), and each of these averages is also in a rising state. This layered, rising moving average arrangement works as a set of active support points.
- Market Outperformance: With a yearly result better than 88% of all stocks, XOM is not only going up, it is doing better than the wider market. This comparative force is a main sign of leading stocks.
- Notable Force: The stock's result over the last three, six, and twelve months has been very good, with increases of about 30%, 38%, and 39% in turn, highlighting the notable force behind the move.
This mix of parts creates a base of technical condition. For the rise method, a high Technical Rating answers the important question of which stock to study, it finds those with the highest chance of continuing a confirmed upward trend.
Setup State: Finding the Entry Chance
While a solid trend is needed, it is not enough for a best entry. Buying a stock that has just jumped can lead to quick drops. The second part, then, is finding a high-state pause or "setup" inside that trend. This is where the Chartmill Setup Quality Rating is used, dealing with the question of when to study an entry. Exxon Mobil gets an 8 here, pointing to a clear pause pattern.
The technical report notes the features of this setup:
- Pause Happening: Over the last month, XOM has moved in an area between about $145 and $160. It is now trading in the middle of this area, after a recent step back from the highs. This time of lower change and side-to-side action after a good climb is classic pause activity.
- Clear Support and Resistance: The setup is shaped by clear technical points.
- Resistance: A set area exists near $155.56 - $155.57, which the stock recently neared but did not pass.
- Support: An important support area sits between $146.18 and $147.27, made by a meeting of trendlines.
- Possible Trade Plan: The report notes a possible rise setup where a move above the resistance area (near $155.58) could show a restart of the upward trend. A stop-loss order set below the nearby support area (near $146.76) would set the trade's risk, which is measured at about 5.7% based on these points.
This ordered setting, with clear limits, lower change, and a reasoned entry signal, is what the Setup Quality Rating tries to record. It suggests the stock is "winding" and may be getting ready for its next directional move.
Summary and Following Actions
Exxon Mobil shows a standard case for technical investors using a rise method. The stock has the two credentials looked for by this method: a first-class Technical Rating (10) confirming a strong, multi-timeframe upward trend, and a high Setup Quality Rating (8) noting a logical pause pattern with set risk measures. This mix suggests XOM is a market leader that has stopped to absorb its gains and may be placing for a continued climb.
It is key to recall that technical patterns show chances, not guarantees. The noted entry and exit points come from the present chart arrangement and must be judged next to other parts like general market state and basic news.
Want to find other stocks now showing like technical signs? You can use the same rise search that found XOM with the Technical Breakout Setups tool to find new chances each day.
Disclaimer: This article is for information only and is not investment guidance, a suggestion, or a deal or request to buy or sell any securities. The study is based on technical facts and patterns, which are not sure to guess future results. All trading and investment choices have risk, including the possible loss of main funds. Readers should do their own study and talk with a registered money advisor before making any investment choices.