
Growth investing strategies often look for companies with strong earnings momentum, market leadership, and sound financial traits. One organized method for this style of investing is the CAN SLIM system, made popular by William O’Neil. This method uses both fundamental and technical study to find high-growth stocks that may perform well. The letters represent Current quarterly earnings, Annual earnings increases, New products or highs, Supply and demand, Leader or laggard, Institutional sponsorship, and Market direction. A recent filter using these ideas has identified Vista Energy SAB de CV (NYSE:VIST) as a stock that deserves further examination.
Fundamental Strength: The Center of CAN SLIM
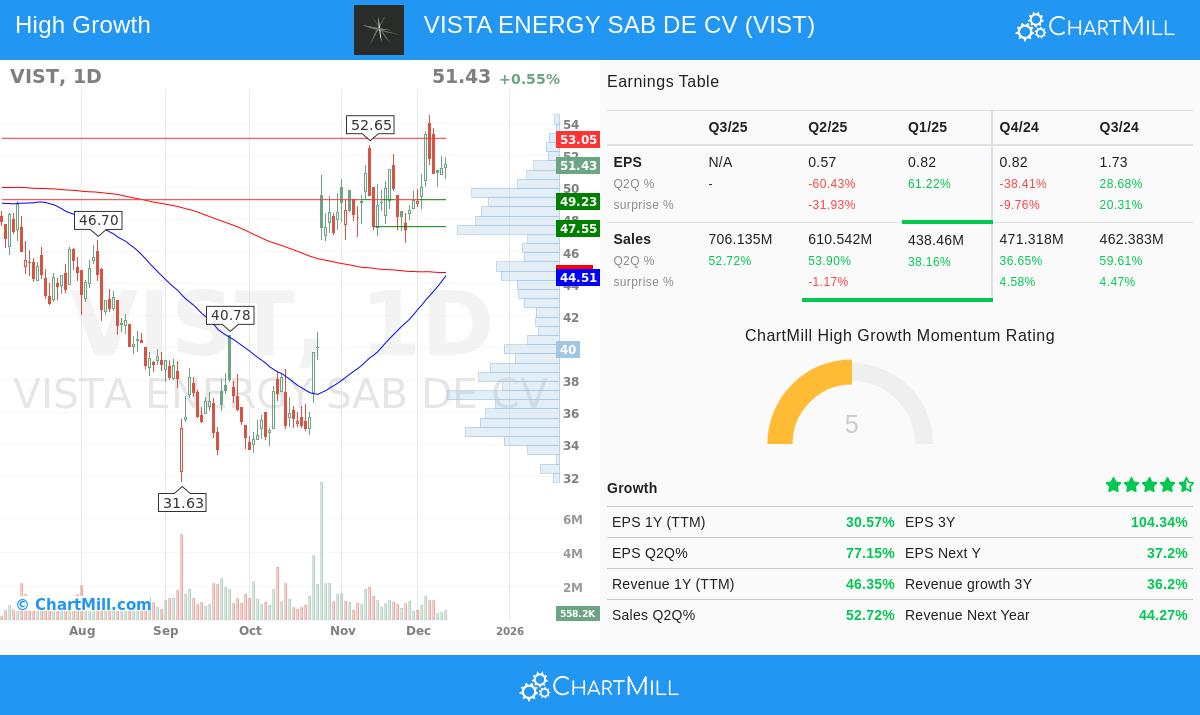
The "C" and "A" in CAN SLIM concentrate on current and yearly earnings power, which are vital for finding real growth. Vista Energy shows notable strength in these areas, as described in its fundamental analysis report.
- Current Earnings & Sales (C): The company reported a 77.2% year-over-year rise in earnings per share for its latest quarter, well above the method's usual minimum of 18-20%. Quarterly revenue growth was also strong at 52.7%, showing good top-line momentum.
- Annual Earnings Increases (A): Over the last three years, Vista Energy's EPS has increased at a compound annual rate of 104.3%, displaying a lasting period of high profitability growth. This matches the strategy's aim for "big growth."
- Profitability & Efficiency: Supporting these growth numbers is a solid Return on Equity (ROE) of 30.4%, putting it with the best in its field. High ROE is an important profitability measure in the CAN SLIM system, showing efficient use of shareholder money.
Market Position and Technical Picture
The "L," "I," and parts of "N" and "S" connect to how the market views and trades the stock. Vista Energy's technical profile, described in its technical analysis report, shows several positive points.
- Leader vs. Laggard (L): The stock has a relative strength rating of 81.4, meaning it has done better than over 81% of the market. This is a central part of the CAN SLIM idea, which looks for market leaders, not laggards.
- Institutional Sponsorship (I): With institutional ownership near 12.8%, the stock fits the need for some institutional interest while keeping room for more ownership, a possible source of future buying.
- Supply, Demand, and New Highs (S & N): While the stock is not at a new 52-week high, its strong relative strength indicates it is a leader in its sector. The technical report states both long-term and short-term trends are good, and the stock is now moving within a trading range, which the method calls forming a "properly made base" for a possible future price change.
Valuation and Financial Health Points
While the CAN SLIM method focuses on growth and momentum, it also looks at financial stability. Vista Energy shows a varied picture here, which investors should note.
- Reasonable Valuation: The stock seems priced low compared to both its industry and the wider market, with a Price-to-Earnings ratio of 11.4 and a forward P/E of 9.8. This offers a buffer not always seen in high-growth stocks.
- Debt and Liquidity Observations: The company's Debt-to-Equity ratio near 1.0 is elevated, and its current ratio points to possible short-term liquidity issues. These items lead to a lower financial health score in the fundamental report. CAN SLIM investors usually want low debt, making this an area for careful study.
Summary and Strategic View
In summary, Vista Energy shows a strong profile for a growth-focused screening process. It meets the main CAN SLIM needs of high quarterly and yearly earnings growth, strong profitability, and good market-relative performance. The stock's technical position is favorable, and its price is sensible. However, investors must weigh this against the noted points about financial leverage and liquidity.
The present market setting, with the S&P 500 in a positive long-term and short-term trend, meets the "M" (Market Direction) part of the strategy, indicating a supportive environment for looking at growth-focused ideas.
For investors wanting to see other companies that pass similar growth and momentum filters, you can see the full CANSLIM High Growth screen results here.
Disclaimer: This article is for information only and is not investment advice, a suggestion, or an offer to buy or sell any security. The study is based on data and a set screening method; it is not a replacement for your own research and careful review. Investing has risk, including the possible loss of the amount invested. Always think about your personal financial situation and talk with a qualified financial advisor before making any investment choices.