
For investors looking to find high-growth market leaders, the CAN SLIM method, made known by William O'Neil, provides a structured approach. This growth investing plan joins fundamental analysis to locate solid companies with technical analysis to time purchases. The method concentrates on stocks showing strong earnings and sales increases, notable institutional interest, and a leading position in their field, all while noting the need to purchase during established market advances. A recent filter using main CAN SLIM rules has identified one such prospect for more examination: Vista Energy SAB de CV (NYSE:VIST).
Fundamental Health: The "CAN" in CAN SLIM
The first letters of the CAN SLIM term center on the fundamental driver of a company. Vista Energy seems to show health across a number of these important measures.
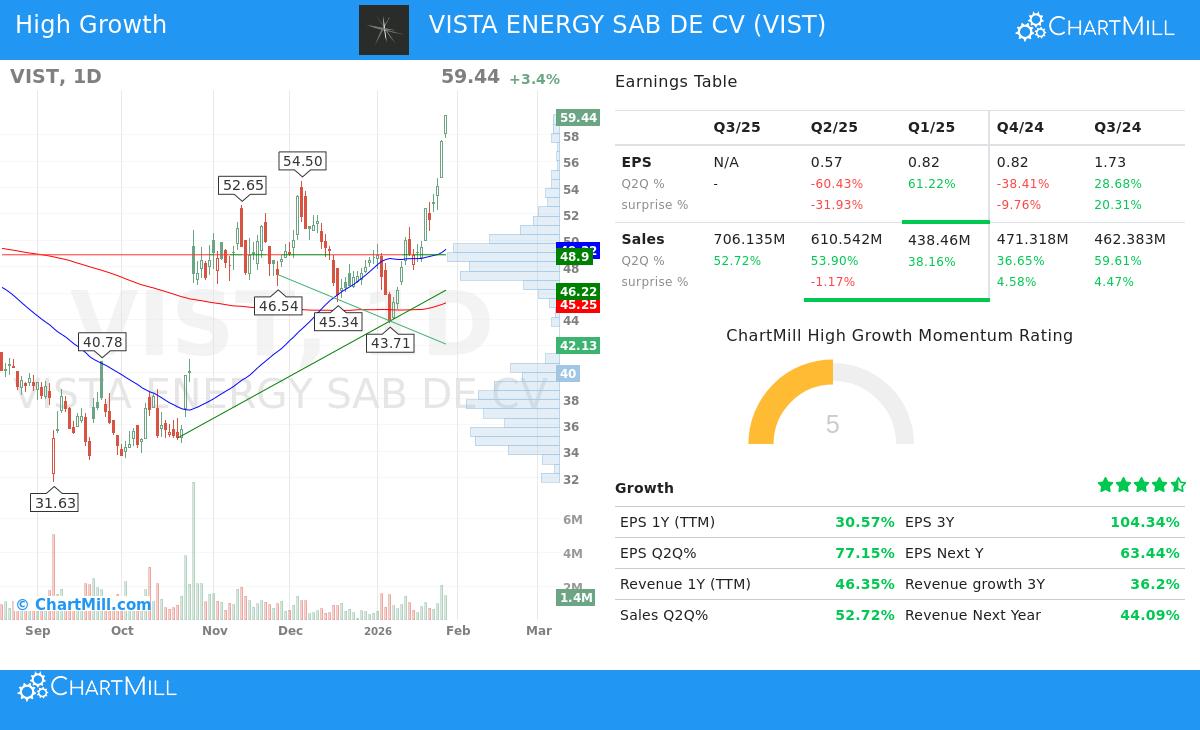
- Current Quarterly Earnings & Sales (C): The method requires large, and ideally speeding up, quarterly increases. VIST states a quarterly earnings per share (EPS) increase of 77.15% and a sales increase of 52.72% versus the same quarter last year. These numbers greatly pass the usual CAN SLIM lowest limits of 20-25%, showing strong recent movement.
- Annual Earnings Gains (A): To confirm steadiness, CAN SLIM requires a solid history. Vista Energy’s three-year EPS compound annual growth rate (CAGR) is at a notable 104.34%, greatly exceeding the method's standard. Also, the company has a Return on Equity (ROE) of 30.36%, which is above the 10% minimum and shows good use of shareholder money.
- Supply & Demand (S): A reasonable amount of debt is favored. VIST’s debt-to-equity ratio is about 1.0. While this is at the top of the range and needs notice for financial condition, it stays under the filter's limit of 2, as seen in the fundamental analysis report.
Market Acceptance: The "SLIM" in CAN SLIM
The last part of the method assesses how the market is accepting a company's fundamental health, which is key for timing.
- Leader or Laggard (L): CAN SLIM investors look for market leaders, not laggards. This is measured using relative strength, which compares a stock's price action to the wider market. VIST has a relative strength of 77.46, meaning it has done better than over 77% of all stocks. This meets the filter's need to be above 75, putting it clearly in market leader status.
- Institutional Sponsorship (I): Rising interest from institutional investors (like mutual funds) can give support for a stock's price. VIST shows an institutional ownership level of about 12.7%. While not high, this is under the 85% maximum used in the filter, allowing space for more institutional purchases as the company gets more attention.
- Market Direction (M): The last, and possibly most important, rule is to follow the general market trend. The present situation, with both the short and long-term trends for the S&P 500 favorable, meets this need for looking at new CAN SLIM-type investments.
Technical and Fundamental Overview
An examination of VIST's separate reports gives a united view. The technical analysis report gives the stock a high score of 8 out of 10, seeing its firm positive trends across several periods and its recent move to a new 52-week high, a standard CAN SLIM buy sign. The report does warn that the fast recent rise may need a time of settling before a good entry point appears.
The fundamental analysis report shows a varied but hopeful profile, with an overall score of 5 out of 10. It points out outstanding profit and growth measures, including top industry margins and solid past and expected future growth. These positives are balanced by questions about liquidity and financial condition, especially a low current ratio. The price is seen as fair, particularly compared to its growth potential and the wider market.
A Prospect for More Study
Vista Energy offers a strong example for investors using the CAN SLIM method. It shows the large quarterly and annual earnings increases the method looks for, along with the firm market-relative price action that signals institutional finding. Its present technical state matches a positive market setting. However, the fundamental questions about balance sheet liquidity and the technically stretched price move highlight that this is not without risk. It shows a high-growth, high-movement prospect that needs detailed investigation, firm stop-loss rule following, and a knowledge of the changing nature of the energy sector.
Interested in seeing other stocks that meet similar CAN SLIM-based filters? You can examine and adjust the screening rules used in this study through the pre-defined O'Neill CANSLIM High Growth screen.
Disclaimer: This article is for information and learning only. It is not a suggestion to buy, sell, or keep any security. The CAN SLIM method carries notable risk, and prior results do not guarantee future outcomes. All investment choices should come from your own study, risk comfort, and money situation. Think about talking with a qualified financial advisor before making any investment choices.