
Technical investors often look for stocks showing both good existing momentum and attractive buying opportunities. One methodical process involves filtering for securities with high technical ratings that measure trend persistence, paired with high setup quality scores that find accumulation patterns before possible upward moves. This system tries to identify stocks in confirmed upward trends that are resting before their next possible phase of advance, giving clear risk levels for trade initiation.
Take-Two Interactive Software (NASDAQ:TTWO) appears from this kind of filter, presenting a strong case for technical review. The video game publisher, known for series like Grand Theft Auto and NBA 2K, currently displays the technical traits that frequently draw momentum-focused investors.
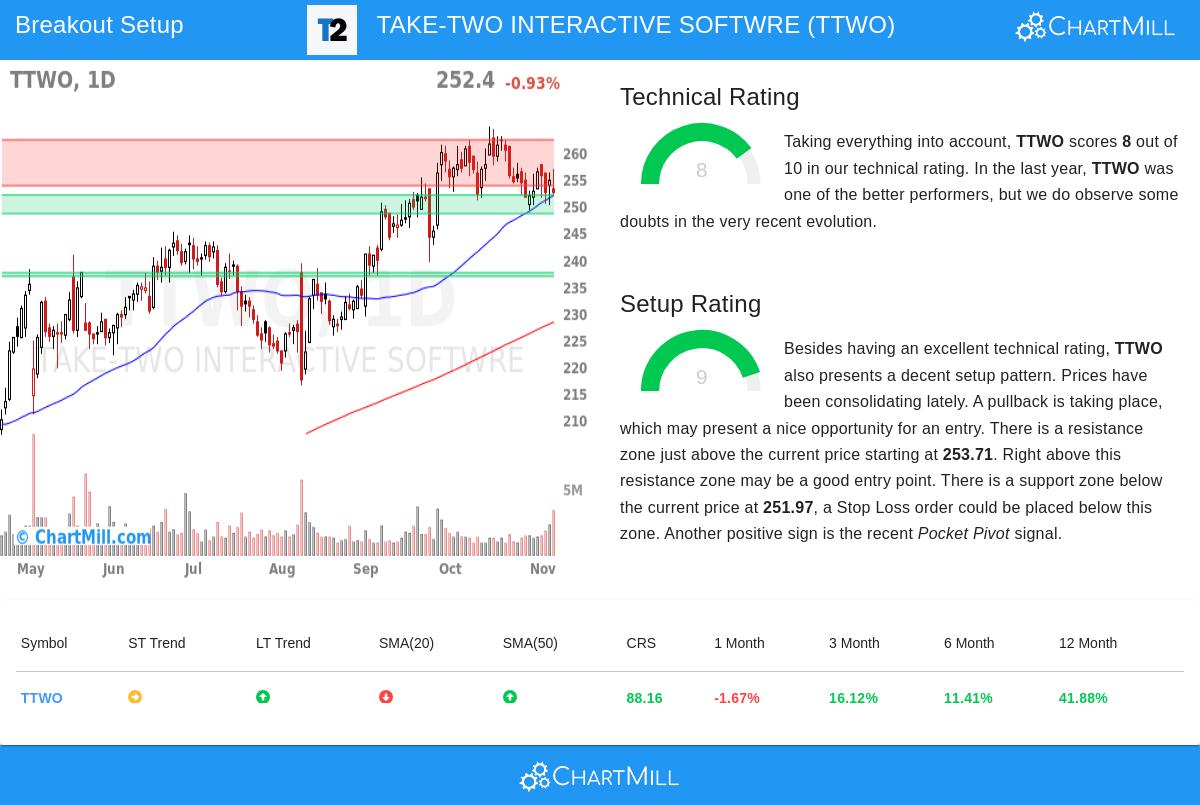
Technical Strength Review
Take-Two Interactive receives a good technical rating of 8 out of 10, indicating persistent existing trend force. This rating shows several favorable elements that match the breakout method's need for stocks in confirmed upward trends. The detailed technical report shows various supporting data:
- Long-term trend: POSITIVE
- Relative strength: Performs better than 88% of all stocks over the last year
- Industry ranking: Performs better than 83% of entertainment industry companies
- Moving averages: Price is higher than all main moving averages (50, 100, and 200-day)
The stock's location in the higher part of its 52-week span, together with steady price gain behavior, confirms the technical rating. For breakout methods, this technical condition is important as it implies the stock has the momentum needed to possibly maintain a breakout advance.
Setup Quality Review
Apart from technical force, Take-Two shows a very good setup quality rating of 9 out of 10. This high rating suggests the stock is creating an accumulation formation that may come before a notable price change. The setup review shows various positive parts:
- Consolidation range: Trading between $249.24 and $264.79 over the last month
- Current position: Accumulating in the middle of this span
- Support zone: Clear support found between $248.49 and $251.97
- Recent signal: A pocket pivot pattern noted, showing institutional buying
The mix of price accumulation inside a set span and closeness to important support levels forms the kind of setup that technical investors frequently want. This formation allows for precise risk setting, with reasonable stop-loss points under the support area.
Trading Activity and Market Setting
Trading volume behavior supports the technical view, with average daily volume of about 1.54 million shares giving enough market fluidity for trade start and exit. The stock's activity within the wider market situation is also significant, as TTWO is accumulating while the S&P 500 displays a positive short-term trend, possibly showing shifting investor interest.
The existing technical arrangement implies a possible move above the $253.71-$262.30 resistance area could indicate the next rising phase. The nearness to this resistance zone, combined with the good technical base, forms what technical reviewers often call a "coiled spring" setup.
Method Application Points
For investors using this breakout system, the review suggests watching TTWO for an advance above the noted resistance zone with protective stops under the support level. The set risk levels, showing about 3.4% from start to stop-loss, give a quantifiable risk structure that fits with organized technical trading methods.
The existence of several support levels below the existing price gives extra confirmation of the stock's technical condition, possibly offering other entry points if the stock checks these levels before moving up.
Investors looking for related technical breakout possibilities can check the Technical Breakout Setups screen for daily refreshed candidates meeting these particular technical standards.
Disclaimer: This review is based on technical measures and formation identification and should not be taken as investment guidance. Always perform your own investigation, think about your risk capacity, and talk with a financial consultant before making investment choices. Technical review has limits and does not assure future results.