
TRAVEL + LEISURE CO (NYSE:TNL) was identified as a decent value stock by our stock screener. TNL scores well on profitability, solvency and liquidity. At the same time it seems to be priced very reasonably. We'll explore this a bit deeper below.
A Closer Look at Valuation for TNL
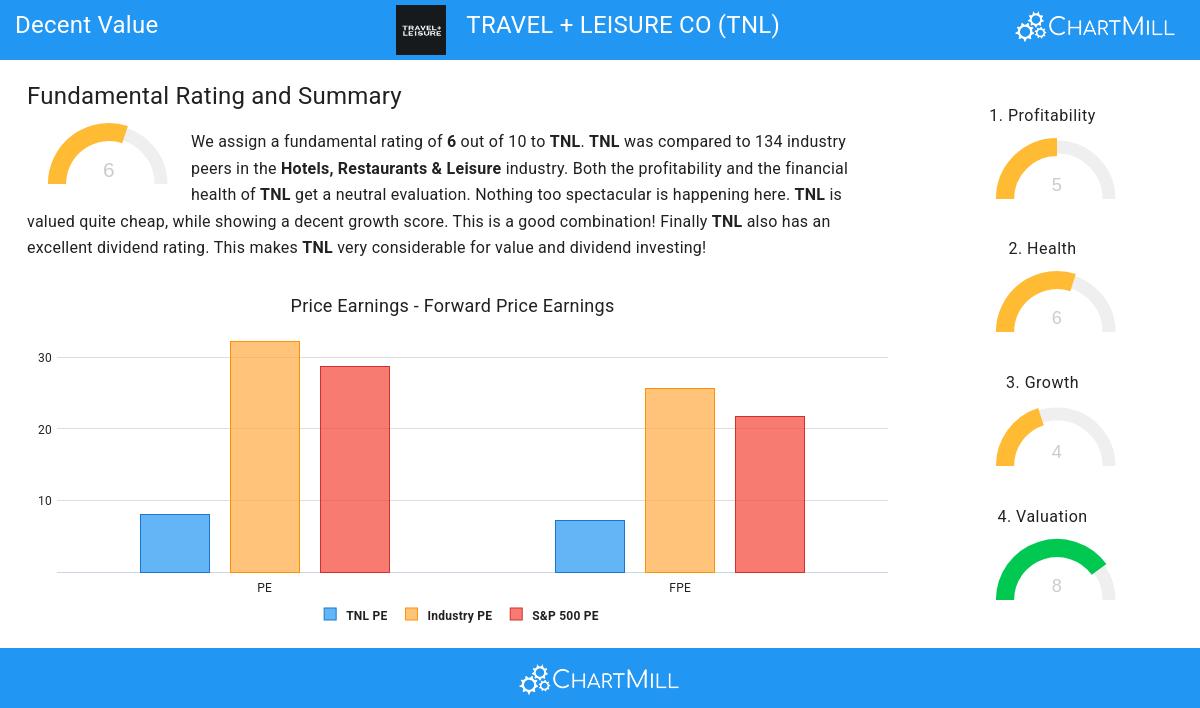
An integral part of ChartMill's stock analysis is the Valuation Rating, which spans from 0 to 10. This rating evaluates diverse valuation factors, including price to earnings and cash flows, while considering the stock's profitability and growth. TNL has received a 8 out of 10:
- A Price/Earnings ratio of 8.07 indicates a reasonable valuation of TNL.
- TNL's Price/Earnings ratio is rather cheap when compared to the industry. TNL is cheaper than 94.03% of the companies in the same industry.
- The average S&P500 Price/Earnings ratio is at 28.68. TNL is valued rather cheaply when compared to this.
- With a Price/Forward Earnings ratio of 7.18, the valuation of TNL can be described as very cheap.
- Compared to the rest of the industry, the Price/Forward Earnings ratio of TNL indicates a rather cheap valuation: TNL is cheaper than 94.78% of the companies listed in the same industry.
- The average S&P500 Price/Forward Earnings ratio is at 21.72. TNL is valued rather cheaply when compared to this.
- 67.91% of the companies in the same industry are more expensive than TNL, based on the Enterprise Value to EBITDA ratio.
- Based on the Price/Free Cash Flow ratio, TNL is valued cheaper than 91.79% of the companies in the same industry.
- TNL's low PEG Ratio(NY), which compensates the Price/Earnings for growth, indicates a rather cheap valuation of the company.
- A more expensive valuation may be justified as TNL's earnings are expected to grow with 15.35% in the coming years.
Profitability Assessment of TNL
ChartMill employs its own Profitability Rating system for stock evaluation. This score, ranging from 0 to 10, is derived from an analysis of diverse profitability metrics and margins. In the case of TNL, the assigned 5 is noteworthy for profitability:
- With a decent Return On Assets value of 6.10%, TNL is doing good in the industry, outperforming 75.37% of the companies in the same industry.
- TNL has a Return On Invested Capital of 10.54%. This is in the better half of the industry: TNL outperforms 76.12% of its industry peers.
- The last Return On Invested Capital (10.54%) for TNL is above the 3 year average (10.16%), which is a sign of increasing profitability.
- TNL's Profit Margin of 10.63% is fine compared to the rest of the industry. TNL outperforms 75.37% of its industry peers.
- The Operating Margin of TNL (19.48%) is better than 77.61% of its industry peers.
Health Analysis for TNL
ChartMill employs a unique Health Rating system for all stocks. This rating, ranging from 0 to 10, is determined by analyzing various liquidity and solvency ratios. For TNL, the assigned 6 for health provides valuable insights:
- Looking at the Altman-Z score, with a value of 2.26, TNL is in the better half of the industry, outperforming 65.67% of the companies in the same industry.
- A Current Ratio of 3.72 indicates that TNL has no problem at all paying its short term obligations.
- The Current ratio of TNL (3.72) is better than 96.27% of its industry peers.
- A Quick Ratio of 2.71 indicates that TNL has no problem at all paying its short term obligations.
- Looking at the Quick ratio, with a value of 2.71, TNL belongs to the top of the industry, outperforming 92.54% of the companies in the same industry.
Exploring TNL's Growth
ChartMill assigns a proprietary Growth Rating to each stock. The score is computed by evaluating various growth aspects, like EPS and revenue growth. We take into account the history as well as the estimated future numbers. TNL was assigned a score of 4 for growth:
- Based on estimates for the next years, TNL will show a quite strong growth in Earnings Per Share. The EPS will grow by 15.35% on average per year.
- When comparing the EPS growth rate of the last years to the growth rate of the upcoming years, we see that the growth is accelerating.
- When comparing the Revenue growth rate of the last years to the growth rate of the upcoming years, we see that the growth is accelerating.
Every day, new Decent Value stocks can be found on ChartMill in our Decent Value screener.
Check the latest full fundamental report of TNL for a complete fundamental analysis.
Disclaimer
This is not investing advice! The article highlights some of the observations at the time of writing, but you should always make your own analysis and invest based on your own insights.