
In growth investing, joining a strict technical system with attention to fundamental momentum can be a strong method for spotting possible leaders. One example is the Mark Minervini method, which brings together his specific Trend Template with a detailed study of earnings and sales increases. The Trend Template works as a technical screen, confirming a stock is in a clear, strong uptrend by examining important moving average positions and relative performance. This is combined with a look for "High Growth Momentum" (HGM), a concentration on firms showing fast and increasing growth in profits and sales, the sort of fundamental driver that can push a stock's price for a long time. A stock that meets both the strict technical requirements and shows solid HGM features presents an interesting case for more study.
TRIPLE FLAG PRECIOUS METALS CORP. (NYSE:TFPM) recently appeared from a scan made to find these dual-qualifying chances. The streaming and royalty company, which gives access to gold and silver output from a worldwide collection of mines, seems to match the main ideas of this joined method.
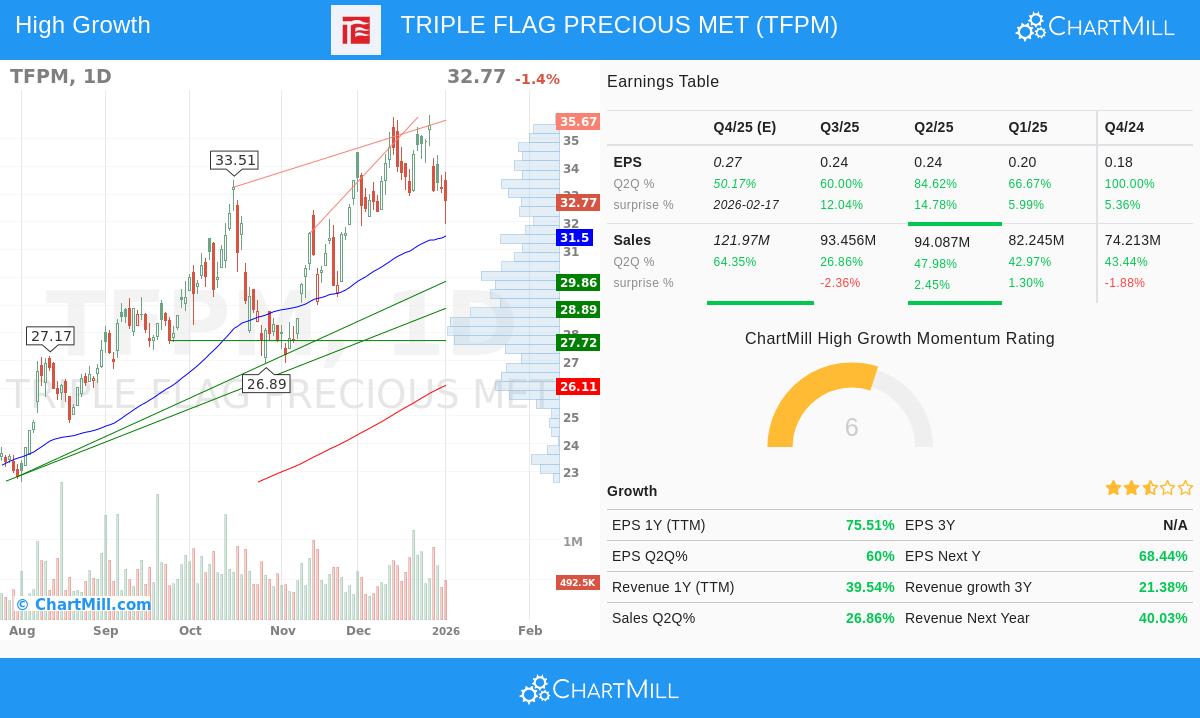
Technical Match with the Minervini Trend Template
The Minervini Trend Template is made to prevent guesses on downtrends and instead direct money to stocks where the easiest path is clearly upward. TRIPLE FLAG PRECIOUS METALS CORP. now fits the important technical conditions that describe this sound uptrend, or "Stage 2" rise.
- Moving Average Position: The stock's price is trading above all main simple moving averages (50-day, 150-day, and 200-day). Also, these averages are in the correct bullish order: the shorter 50-day SMA ($31.50) is above both the 150-day ($27.97) and 200-day ($26.11) averages, and the 150-day is above the 200-day. This layered, increasing position shows continued buying interest across many periods.
- Nearness to Highs: A central part of Minervini's thinking is to buy strength, not decline. TFPM's present price is about 117% above its 52-week low of $15.10, showing a strong recovery pattern. While it is now about 8.6% below its 52-week high of $35.86, it stays inside the important 25% limit, keeping it in the area of leading stocks instead of large pullbacks.
- Better Relative Performance: Maybe most key, TFPM has a ChartMill Relative Strength (CRS) ranking of 95.3. This means its price action over the past year has done better than 95% of all stocks. Minervini notes that real market leaders regularly do better than the wider market, and a high RS score is a direct measure of that leadership.
Fundamental Driver: High Growth Momentum (HGM)
A sound chart is often a sign of basic business health. For a growth-centered method, the fundamental view must show not only growth, but speeding growth. TRIPLE FLAG's recent financial results display several signs of high growth momentum that could act as a reason for more price gains.
- Fast Earnings Increase: The company's earnings per share (EPS) growth is notable. Trailing twelve-month (TTM) EPS has increased over 75% year-over-year. Looking at recent quarters shows even stronger speed, with the last quarter showing 60% year-over-year growth, the quarter before at 84.6%, and the quarter before that at 66.7%. This sequence of regularly high and speeding bottom-line growth is just what growth investors look for.
- Solid and Growing Profitability: This earnings jump is helped by clearly growing profit margins. The company's profit margin in the newest quarter hit 66.3%, up in order from 59.2% the quarter before and 55.3% the quarter before that. This direction of growing margins shows working efficiency and pricing strength, which are main reasons for lasting earnings growth.
- Sound Sales Path: Top-line growth is also solid, with TTM sales up almost 40% year-over-year. Recent quarterly sales growth has been regularly sound, varying from 26.9% to 48% over the past three quarters. Also, analysts are becoming more positive, increasing their sales forecasts for the next year by over 6.6% in the last three months.
- Regular Delivery: The company has passed EPS forecasts in each of the last four quarters, with an average beat of over 9.5%. This record of going past expectations builds trust with investors and can lead to positive earnings surprises, a key reason Minervini points to for strong stock moves.
Technical Condition and Pattern Summary
Beyond the exact Trend Template screens, a wider view of TFPM's technical condition is positive. ChartMill's own Technical Rating gives the stock a full score of 10 out of 10, noting a "consistent performance in both the short and longer term time frames." The long-term trend is rated as positive, and the stock is mentioned for showing "a nice and consistent pattern of rising prices."
The technical study also finds a good pattern, with a Setup Rating of 7. The report notes lower volatility and price tightening in the recent period, which may be forming a base for the next possible move. Several support areas are found below the present price, with the closest major support grouped near $32.76, giving a sensible area for risk control.
For a detailed look at the support and resistance levels, and the full technical study, you can see the complete ChartMill Technical Report for TFPM.
A Case for More Study
TRIPLE FLAG PRECIOUS METALS CORP. presents a situation where a sound technical trend, as described by the Minervini template, is supported by a fundamental story of speeding earnings and sales growth. This match fits with methods that aim to invest in market leaders during their growth period. It is key to see that the stock has seen strong advances over the past year and is now dipping from recent highs, which calls for close study of entry points and risk control, as with any investment.
Interested in finding other stocks that fit this mix of high-growth fundamentals and sound technical trends? You can inspect the preset scan that found TFPM and find more possible cases by visiting the High Growth Momentum + Trend Template screen on ChartMill.
Disclaimer: This article is for informational and educational purposes only. It is not a recommendation to buy or sell any security. The analysis is based on data provided and specific screening criteria. All investing involves risk, including the potential loss of principal. You should conduct your own research and consider consulting with a qualified financial advisor before making any investment decisions.