
In the world of growth investing, combining a solid technical framework with firm fundamental momentum can be a good method for finding possible leaders. One way of thinking that shows this is the strategy made known by trader Mark Minervini, which depends on his Specific Entry Point Analysis (SEPA). The center of this method is the Trend Template, a fixed group of technical filters made to find stocks in clear, strong uptrends. This makes sure an investor looks only at securities where the price momentum is clearly positive and institutional buying is probably happening. To add to this technical condition, the strategy then includes fundamental analysis, looking for companies showing speeding earnings and sales growth, the kind of fundamental force that can push a stock's momentum forward. A screening method that joins the Minervini Trend Template with a High Growth Momentum (HGM) rating tries to find exactly these kinds of chances: stocks that are not only moving well on the chart but are also supported by very good business results.
Technical Base: Matching the Minervini Trend Template
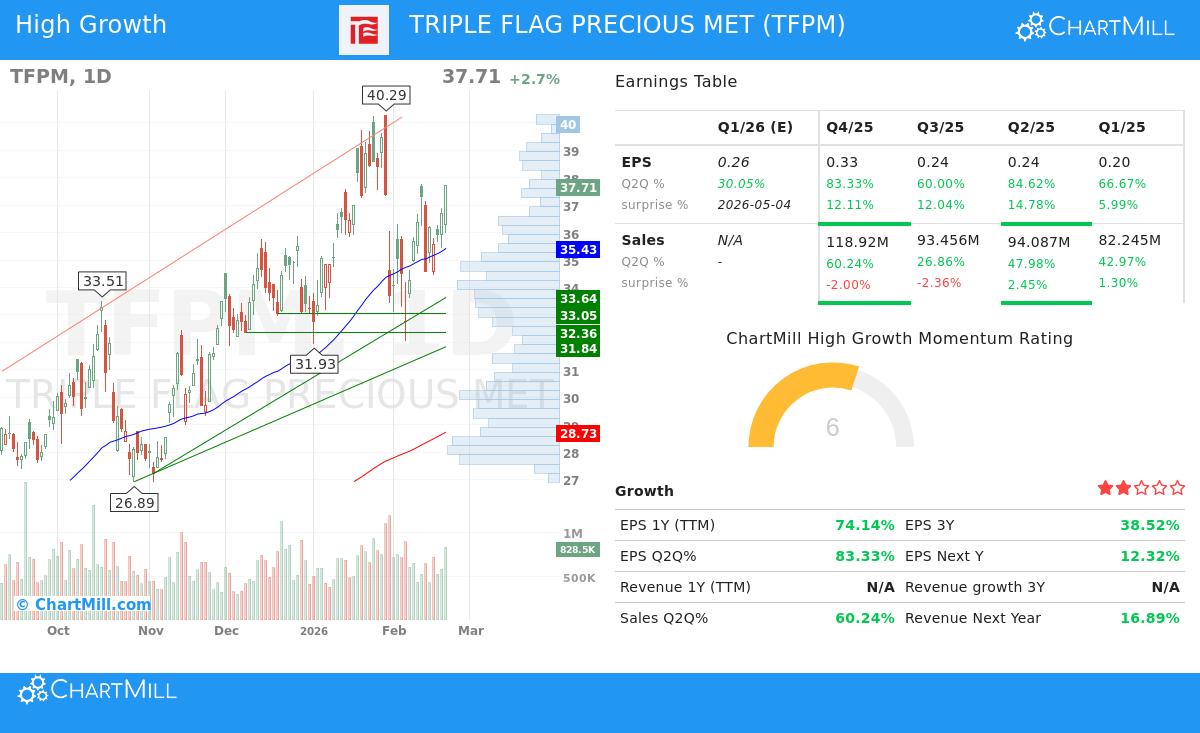
A main reason TRIPLE FLAG PRECIOUS METALS CORP (NYSE:TFPM) is notable is its almost exact match with the technical rules needed by the Minervini Trend Template. This template is not a soft suggestion but a fixed list meant to filter for stocks in a definite Stage 2 advance, staying away from unclear or poor trends.
Currently, TFPM meets the important moving average arrangement rules that point to continued, multi-timeframe condition:
- The current price ($37.71) trades above the rising 50-day ($35.43), 150-day ($30.66), and 200-day ($28.73) simple moving averages (SMAs).
- The 50-day SMA is above both the 150-day and 200-day SMAs.
- The 150-day SMA is above the 200-day SMA, and all three key averages have an upward slope.
Also, the stock's place compared to its 52-week range meets Minervini's focus on condition, not bargain-seeking:
- The current price is about 130% above its 52-week low of $16.40, showing strong recovery and momentum.
- It is trading within 6.4% of its 52-week high of $40.29, showing it is acting as a market leader instead of following.
Last, the stock shows very good relative strength (RS), a central part of the Minervini idea that looks for market leaders. With a ChartMill Relative Strength (CRS) score of 94.96, TFPM is doing better than nearly 95% of all stocks in the market. This mix of arranged moving averages, nearness to highs, and better relative performance makes a strong technical view that points to institutional accumulation and a high-likelihood uptrend.
Fundamental Momentum: The Force for High Growth
While a good chart is necessary, the Minervini strategy looks for the fundamental cause that pushes such results. For high-growth investors, TFPM shows a strong profile of speeding financial results. The company's earnings growth is especially noticeable, showing both steadiness and speeding up, a key feature Minervini searches for in top performers.
The earnings per share (EPS) growth numbers tell a story of strong momentum:
- Year-Over-Year Growth (TTM): EPS has grown 74.1% over the trailing twelve months.
- Sequential Speeding Up: The growth rate has been speeding up on a quarterly basis, with the newest quarter showing 83.3% year-over-year growth, after earlier quarters of 60.0%, 84.6%, and 66.7% growth.
- Estimate Changes: Analysts are noticing, with the average EPS guess for the next fiscal year changed upward by 7.05% over the last three months. Positive changes often come before more price increase as expectations are set higher.
This earnings jump is supported by growing profitability. The company's profit margin in the last reported quarter reached 66.3%, a meaningful growth from 59.2%, 55.3%, and 55.6% in the earlier quarters. Such margin growth shows not just top-line growth, but better operational efficiency and pricing ability, which can meaningfully improve bottom-line results.
Combination: A Strategy-Matched Chance
The coming together of TFPM's technical and fundamental qualities makes it a notable candidate for methods mixing Minervini's ideas with high-growth investing. The strict Trend Template rules make sure the stock is in a clear, leadership-place uptrend, which in the past is the stage where the biggest gains happen. This technical arrangement answers the "when" by finding a good trend state.
At the same time, the fast and speeding EPS growth, growing margins, and positive analyst changes give the fundamental "why." They offer the causing force Minervini's SEPA method looks for, suggesting the good price trend is supported by real business performance gain instead of only speculation. This mix tries to match momentum with substance, looking to take part in a trend that has both technical correctness and fundamental reason.
Technical Condition Summary
A look at the detailed ChartMill Technical Analysis Report for TFPM gives a measured summary of its condition. The report gives TFPM a complete Technical Rating of 10 out of 10, noting a steady and positive performance across both short and long-term timeframes. The long-term and short-term trends are both rated as positive. The report also says the stock is trading in the higher part of its 52-week range and points out its high relative strength compared to the wider market.
The Setup Quality Rating is a firm 6, showing the stock presents an acceptable setup pattern with lower volatility during a recent consolidation period. The analysis finds clear support areas and notes a recent "Pocket Pivot" signal, a volume-based sign often linked to institutional accumulation. While not in a tight, high-scoring base now, the very good technical rating joined with a usable setup suggests the trend stays in place and may offer organized entry points.
For investors wanting to find other companies that show this mix of strong technical trends and high fundamental growth momentum, more study can be done using the preset screen. You can look for more possible candidates by going to the High Growth Momentum + Trend Template screen on ChartMill.
Disclaimer: This article is for information and learning only. It is not a suggestion to buy or sell any security. The analysis is based on given data and certain method frameworks, but it does not make up investment advice. All investing has risk, including the possible loss of principal. Investors should do their own complete study and think about their personal money situation before making any investment choices. Please read our full disclaimer here.