
Technical breakout strategies focus on identifying stocks with strong trends that are consolidating before their next upward move. By using ChartMill’s Technical Rating and Setup Quality Rating, investors can find stocks that show both technical strength and a good entry point. The aim is to capture momentum as the stock moves out of its consolidation phase, while managing risk with clear support and resistance levels.
AT&T INC (NYSE:T) stands out as a candidate for this strategy, with a Technical Rating of 9 and a Setup Rating of 8, indicating both a strong trend and a clear consolidation pattern.
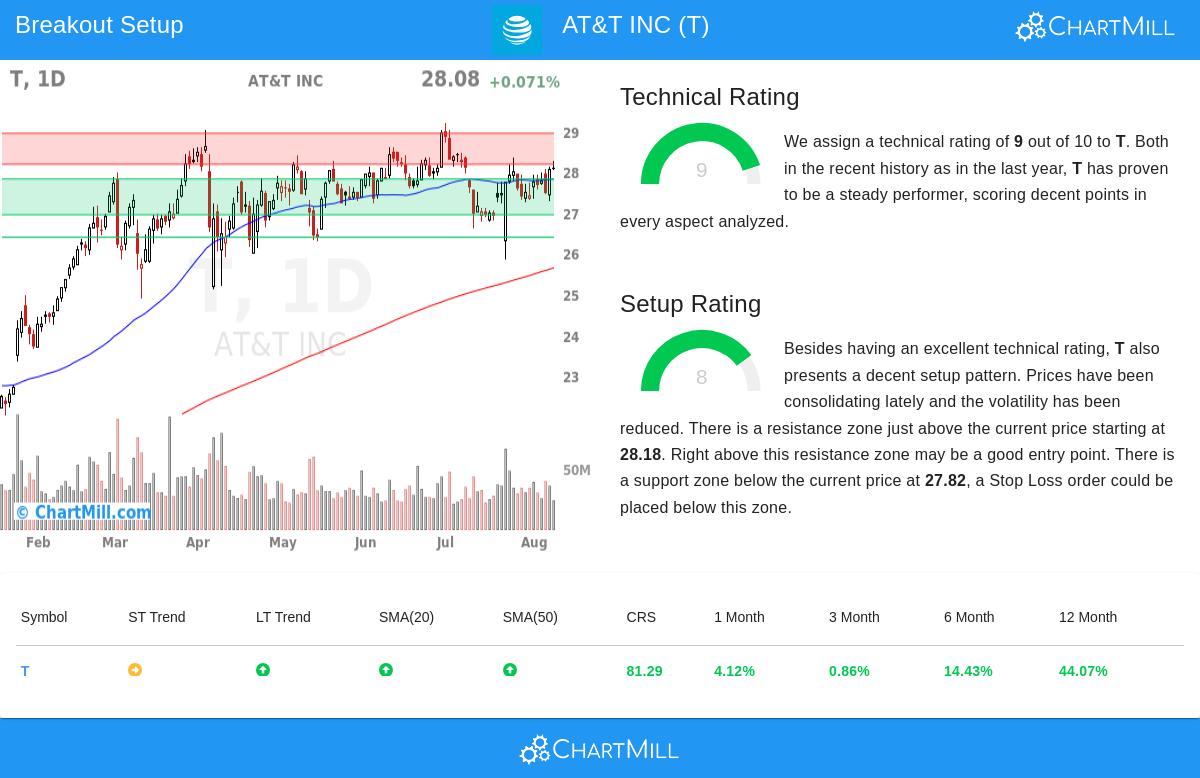
Technical Strength: A High-Rated Uptrend
The Technical Rating measures a stock’s performance across different timeframes, including relative strength, moving averages, and trend consistency. A high score means the stock is doing better than its peers and maintaining a steady uptrend.
For AT&T:
- Long-term trend is positive, while the short-term trend is neutral, suggesting a pause before a possible continuation.
- The stock is trading near its 52-week high ($29.19), though slightly behind the broader S&P 500’s recent highs.
- Yearly performance is better than 81% of all stocks, showing steady upward movement.
- Moving averages (20-day, 50-day, 100-day, and 200-day) are all rising, supporting the bullish outlook.
This fits the breakout strategy’s main idea: trading with the trend improves the chances of success.
Setup Quality: Consolidation Before the Next Move
The Setup Rating checks if a stock is forming a tradable base, offering a clear entry and exit point. A high score suggests tight price action, lower volatility, and defined support and resistance areas.
For AT&T:
- Prices have stayed between $25.85 and $28.35 over the past month, with the stock now testing the upper limit.
- Resistance is at $28.18,$28.94, and a breakout above this could signal new momentum.
- Support is between $26.94,$27.82, providing a logical stop-loss zone.
- The Average True Range (ATR) of 0.60 (1.93% of price) shows moderate volatility, typical of a stock getting ready for a move.
The setup suggests a possible entry above $28.95 (just above resistance) with a stop-loss below $27.23, limiting downside risk to 5.94% per share.
Why This Fits the Breakout Strategy
The mix of strong technicals and a good setup reduces uncertainty:
- Trend confirmation: The high Technical Rating ensures the stock is in a sustained uptrend, not just bouncing.
- Controlled risk: The consolidation zone defines clear support, allowing for disciplined stop placement.
- Breakout potential: A move above resistance could attract more buyers, increasing upside momentum.
For investors looking for similar opportunities, the Technical Breakout Setups screen updates daily with new candidates meeting these criteria.
Disclaimer: This analysis is not investment advice. Always conduct your own research and consider risk management before trading.


