
For investors who use charts and price action to make decisions, the search often comes to two simple questions: which stock is in a strong trend, and when is the right time to buy it? A methodical way to answer these questions is to look for stocks that have both a high technical health score and a high-quality setup pattern. The aim is to find assets that are in a clear uptrend and are also moving in a tight range, indicating a possible breakout is close. This process removes stocks that are either in a weak trend or are too far along to provide a good risk-reward entry.
AT&T INC (NYSE:T) recently appeared from this kind of screening process, making a strong case for technical investors seeking a breakout possibility. The telecommunications company seems to be gaining speed, backed by particular technical measures that point to both existing strength and a well-timed chance.
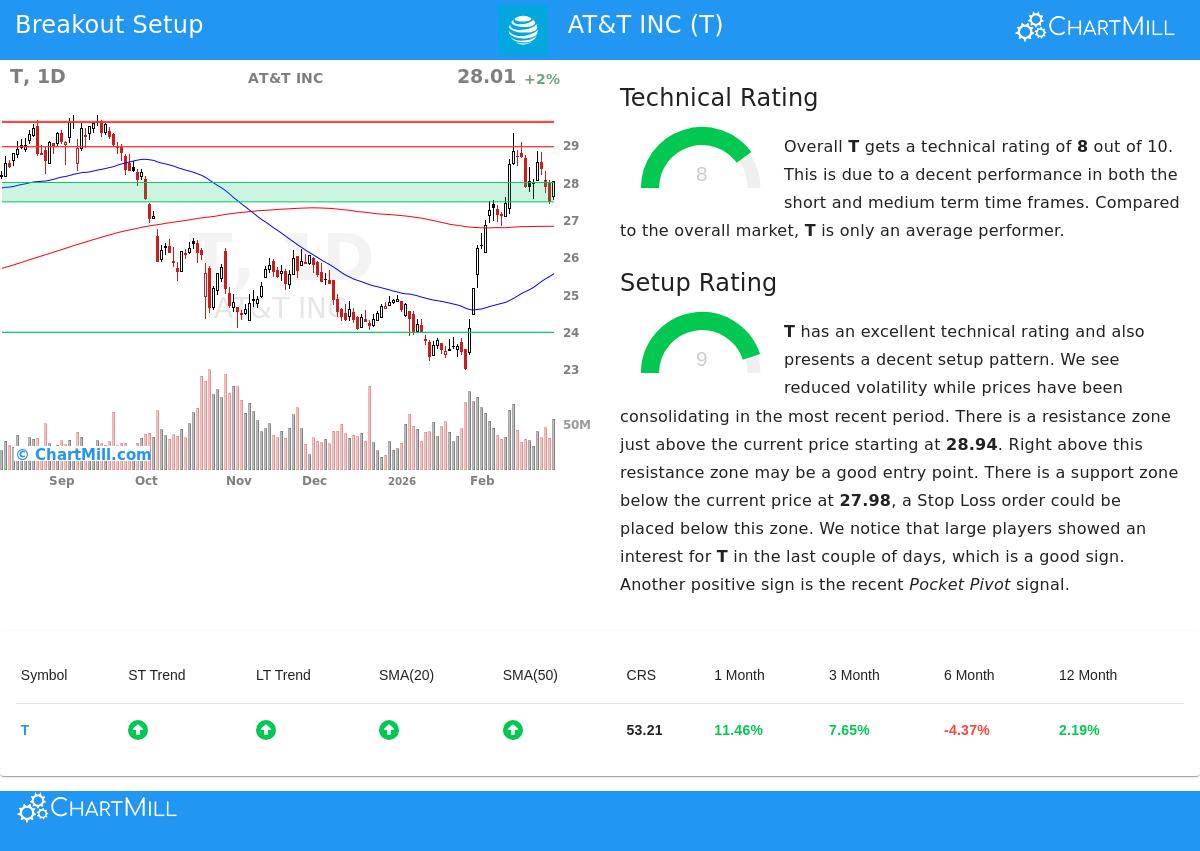
Technical Strength: The Base of the Trend
The first part of this plan is finding a stock with good technical health. ChartMill gives AT&T a Technical Rating of 8 out of 10, a number that measures the stock's trend strength and speed across different time periods. A score this high shows the stock is in a definite uptrend, an important step to skip weaker, flat, or falling stocks.
A closer review of the technical report shows what is behind this high rating:
- Trend Agreement: Both the short-term and long-term trends for AT&T are marked as positive. This agreement across time periods is a strong sign of continued buying interest.
- Moving Average Backing: The stock is priced above all its main simple moving averages (20, 50, 100, and 200-day), and each of these averages is itself in a rising pattern. This forms a stacked support base under the price.
- Position Relative to Market: While the S&P 500's short-term trend is also positive, AT&T is trading in the higher part of its own 52-week range. This indicates the stock is joining in the wider market rise while having its own separate speed.
This mix of elements meets the "which stock" part of the plan. A high Technical Rating confirms AT&T is a stock with sound technicals in a clear uptrend, making it a good choice for more setup review.
Setup Quality: Choosing the Entry Time
A strong trend by itself is not a buy signal; buying at a bad time can cause quick losses if the stock has moved too far. This is where the Setup Quality Rating is key. It gauges how narrowly a stock is moving in a range, which helps find a lower-risk entry point before a possible next upward move. AT&T gets a very good Setup Rating of 9, indicating a high-grade consolidation pattern.
The technical report explains why the setup is strong:
- Consolidation and Bull Flag: The review notes AT&T is currently forming a bull flag pattern. This is a continuation pattern where prices decline slightly in an orderly way after a strong rise, often coming before another upward step.
- Clear Support and Resistance: The setup finds specific, close price levels.
- A support area is present between $27.46 and $27.98, made by a meeting of moving averages and trendlines.
- Immediate resistance is seen at $28.94.
- Supporting Indicators: The report also notes lower recent price swings and positive signs like more interest from big investors (measured by Effective Volume) and a recent Pocket Pivot signal, which points to accumulation.
This high-grade setup directly answers the "when to buy" question. The narrow consolidation above firm support, with a defined resistance level above, allows for a careful trade plan. A possible breakout entry can be set just above the $28.94 resistance, with a protective stop loss placed below the support area, clearly setting the risk.
A Specific Trading Plan
Based on this review, the technical report proposes a sample trading structure. An entry order could be set at $28.95, activated if the stock moves above the noted resistance. A stop-loss order at $27.45 would then control risk, placed below the support area. This plan limits the theoretical maximum loss to about 5.2% on the trade, allowing for exact position sizing.
Find More Possible Breakouts The method that found AT&T can be used each day to find new chances. You can see the present list of stocks fitting similar technical strength and setup quality conditions by going to the Technical Breakout Setups screen.
Disclaimer: This article is for information only and is not investment advice, a suggestion, or an offer to buy or sell any security. The trading setup discussed is an automatic, theoretical example for learning. All investing and trading has risk, including the possible loss of the money you started with. Always do your own complete research, think about your personal money situation and risk comfort, and talk with a qualified financial advisor before making any investment choices. Past results do not guarantee future outcomes.