
Discover PULTEGROUP INC (NYSE:PHM)—an undervalued stock our stock screener has picked out. PHM demonstrates solid fundamentals, including health and profitability, all while staying attractively priced. Let's explore the details.
Analyzing Valuation Metrics
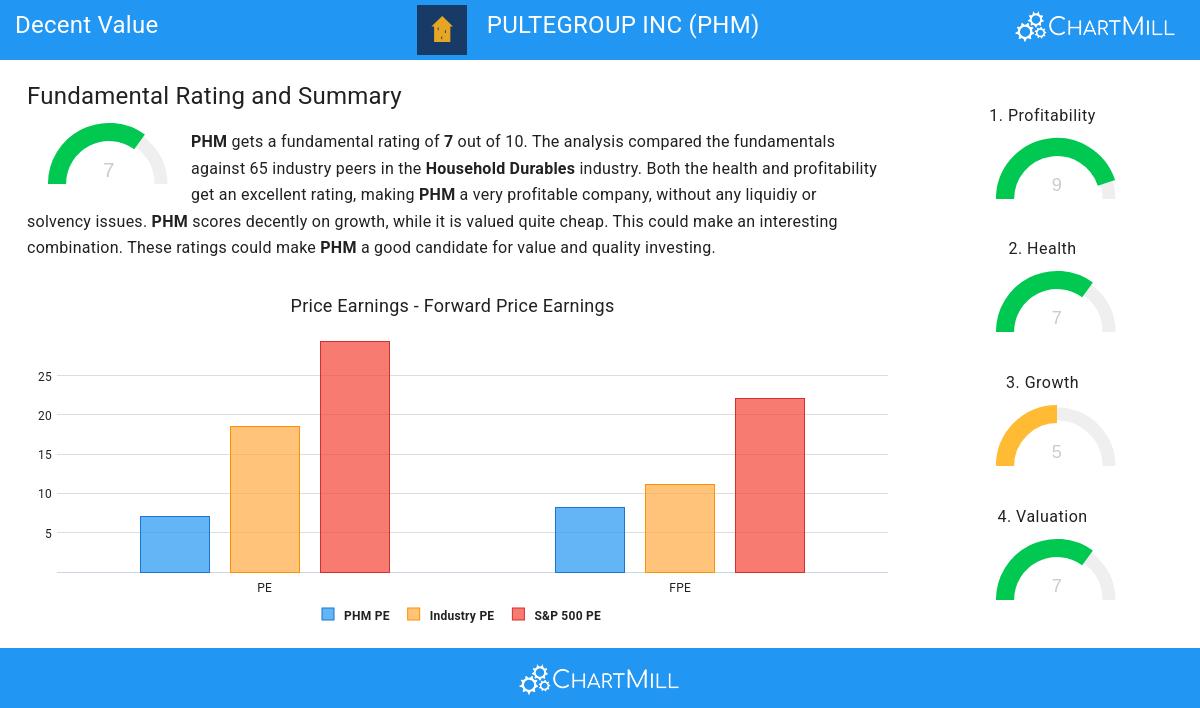
ChartMill assigns a Valuation Rating to each stock, ranging from 0 to 10. This rating is calculated by analyzing different valuation elements, such as price to earnings and free cash flow, both in absolute terms and relative to the market and industry. In the case of PHM, the assigned 7 reflects its valuation:
- PHM is valuated cheaply with a Price/Earnings ratio of 7.01.
- Compared to the rest of the industry, the Price/Earnings ratio of PHM indicates a somewhat cheap valuation: PHM is cheaper than 80.00% of the companies listed in the same industry.
- Compared to an average S&P500 Price/Earnings ratio of 29.40, PHM is valued rather cheaply.
- With a Price/Forward Earnings ratio of 8.23, the valuation of PHM can be described as very reasonable.
- Based on the Price/Forward Earnings ratio, PHM is valued a bit cheaper than the industry average as 72.31% of the companies are valued more expensively.
- When comparing the Price/Forward Earnings ratio of PHM to the average of the S&P500 Index (22.15), we can say PHM is valued rather cheaply.
- Based on the Enterprise Value to EBITDA ratio, PHM is valued cheaper than 89.23% of the companies in the same industry.
- 66.15% of the companies in the same industry are more expensive than PHM, based on the Price/Free Cash Flow ratio.
- PHM has an outstanding profitability rating, which may justify a higher PE ratio.
Evaluating Profitability: PHM
ChartMill assigns a Profitability Rating to every stock. This score ranges from 0 to 10 and evaluates the different profitability ratios and margins, both absolutely, but also relative to the industry peers. PHM scores a 9 out of 10:
- Looking at the Return On Assets, with a value of 17.76%, PHM belongs to the top of the industry, outperforming 96.92% of the companies in the same industry.
- PHM's Return On Equity of 25.44% is amongst the best of the industry. PHM outperforms 87.69% of its industry peers.
- PHM has a better Return On Invested Capital (19.28%) than 95.38% of its industry peers.
- The Average Return On Invested Capital over the past 3 years for PHM is significantly above the industry average of 12.27%.
- The 3 year average ROIC (19.16%) for PHM is below the current ROIC(19.28%), indicating increased profibility in the last year.
- With an excellent Profit Margin value of 17.18%, PHM belongs to the best of the industry, outperforming 93.85% of the companies in the same industry.
- In the last couple of years the Profit Margin of PHM has grown nicely.
- Looking at the Operating Margin, with a value of 21.85%, PHM belongs to the top of the industry, outperforming 93.85% of the companies in the same industry.
- PHM's Operating Margin has improved in the last couple of years.
- In the last couple of years the Gross Margin of PHM has grown nicely.
ChartMill's Evaluation of Health
To gauge a stock's financial health, ChartMill utilizes a Health Rating on a scale of 0 to 10. This comprehensive evaluation encompasses liquidity and solvency, both in absolute terms and in comparison to industry peers. PHM has earned a 7 out of 10:
- PHM has an Altman-Z score of 5.67. This indicates that PHM is financially healthy and has little risk of bankruptcy at the moment.
- PHM has a Altman-Z score of 5.67. This is amongst the best in the industry. PHM outperforms 89.23% of its industry peers.
- PHM has a debt to FCF ratio of 1.38. This is a very positive value and a sign of high solvency as it would only need 1.38 years to pay back of all of its debts.
- Looking at the Debt to FCF ratio, with a value of 1.38, PHM is in the better half of the industry, outperforming 78.46% of the companies in the same industry.
- A Debt/Equity ratio of 0.18 indicates that PHM is not too dependend on debt financing.
- With a decent Debt to Equity ratio value of 0.18, PHM is doing good in the industry, outperforming 70.77% of the companies in the same industry.
- PHM has a Current Ratio of 6.07. This indicates that PHM is financially healthy and has no problem in meeting its short term obligations.
- Looking at the Current ratio, with a value of 6.07, PHM belongs to the top of the industry, outperforming 81.54% of the companies in the same industry.
Growth Assessment of PHM
ChartMill employs its own Growth Rating system for all stocks. This score, ranging from 0 to 10, is derived by evaluating different growth factors, such as EPS and revenue growth, taking into account both past performance and future projections. PHM has earned a 5 for growth:
- The Earnings Per Share has grown by an impressive 25.74% over the past year.
- PHM shows a strong growth in Earnings Per Share. Measured over the last years, the EPS has been growing by 32.15% yearly.
- PHM shows quite a strong growth in Revenue. In the last year, the Revenue has grown by 11.74%.
- PHM shows quite a strong growth in Revenue. Measured over the last years, the Revenue has been growing by 11.94% yearly.
More Decent Value stocks can be found in our Decent Value screener.
Our latest full fundamental report of PHM contains the most current fundamental analsysis.
Keep in mind
This is not investing advice! The article highlights some of the observations at the time of writing, but you should always make your own analysis and invest based on your own insights.