
PennyMac Financial Services (NYSE:PFSI) has recently appeared on a specific screen made to find stocks that fit Mark Minervini's strict trading approach while also showing good fundamental growth traits. This screen uses the technical rules of the Minervini Trend Template to verify a stock is in a confirmed uptrend and pairs it with a High Growth Momentum (HGM) rating to select for companies with notable earnings and sales increases. The method's main idea is to purchase strength, not weakness, by concentrating on market leaders that are already in a strong uptrend and are supported by improving fundamental performance.
Technical Health and the Trend Template
A key part of the Minervini strategy is the Trend Template, a group of fixed technical requirements that verify a stock is in a primary stage 2 uptrend. PFSI currently meets these important conditions, which are made to improve a trader's chances by focusing on stocks with definite momentum.
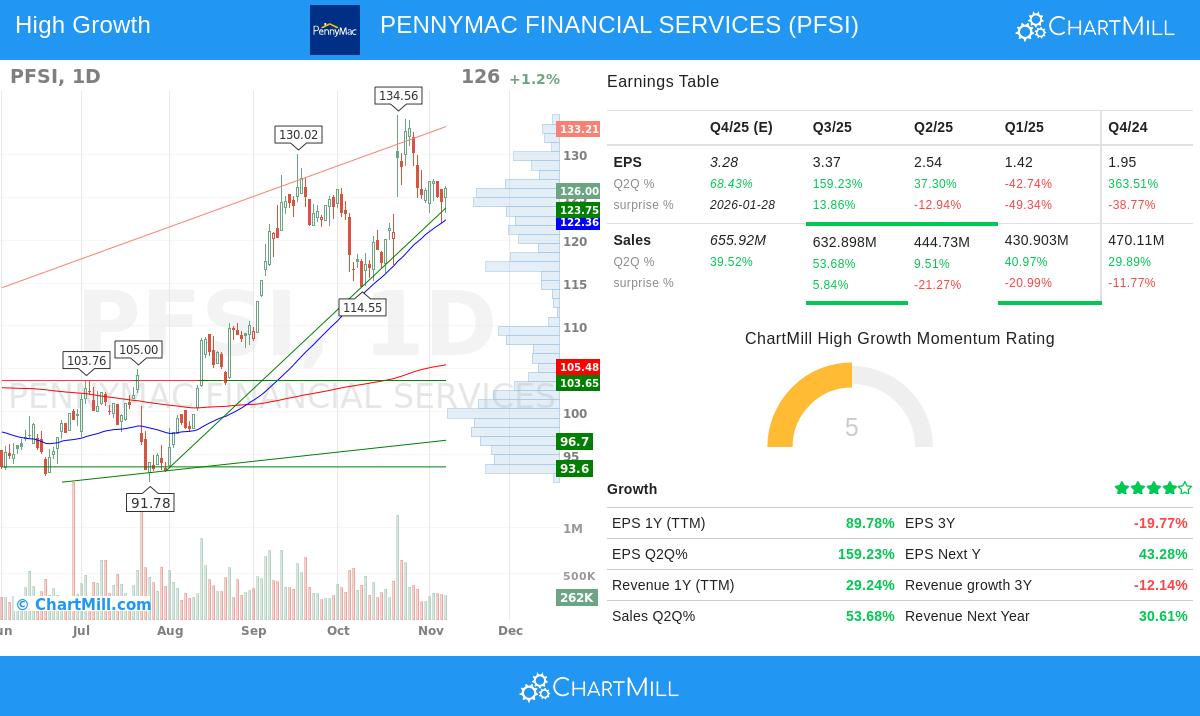
- Price Above Key Moving Averages: The current price of $126.00 is trading above its increasing 50-day ($122.36), 150-day ($106.50), and 200-day ($105.48) simple moving averages. This arrangement confirms that the stock is in a good long-term uptrend.
- Moving Average Alignment: The 50-day moving average is located above both the 150-day and 200-day averages, while the 150-day is also above the 200-day. This sequential arrangement of increasing moving averages is a standard indicator of a solid, confirmed uptrend.
- Proximity to 52-Week High: PFSI is trading within 6.4% of its 52-week high of $134.56, well inside the Trend Template's rule of being within 25% of the high. This shows the stock is displaying strength and leadership, not falling behind.
- Significant Gain from Low: The stock is currently 47% above its 52-week low of $85.74, clearly passing the template's 30% limit and indicating a strong recovery and momentum period.
- Superior Relative Strength: With a relative strength ranking of 86.11, PFSI is doing better than most stocks in the market. Minervini states that real market leaders usually have RS ratings above 70, and ideally in the 80s or 90s.
Fundamental Momentum for Growth Investors
While the Trend Template finds the "when" to buy, the "what" to buy is decided by solid fundamentals. The High Growth Momentum screen looks for companies with very high earnings and sales growth, which frequently serves as the reason for a stock's major price increase. PFSI displays several of these high-growth features.
- Very High Earnings Growth: The company's trailing twelve-month (TTM) EPS has increased by about 90% year-over-year. Even more notable is the most recent quarterly EPS growth of 159% compared to the same quarter last year, showing a major speed-up in profitability.
- Good Revenue Expansion: TTM revenue has increased by over 29%, with the last quarter showing a solid 54% year-over-year rise. This top-line growth confirms that the company is enlarging its business operations successfully.
- Getting Better Profitability: The profit margin in the last reported quarter was 20.56%, showing a sequential improvement and indicating the company's skill at turning revenue into earnings effectively.
These fundamental measures are important because, as Minervini's research indicates, the largest stock market winners nearly always show good and speeding up earnings and sales growth before they make their most important price moves. The mix of these strong fundamentals with a technically good chart forms a high-likelihood setup.
Technical Analysis Summary
The separate ChartMill Technical Report for PFSI gives the stock a high score of 8 out of 10, reflecting its very good technical health. The report states that the long-term trend is positive and that the stock is currently trading in the higher part of its 52-week range, performing similarly to the wider market. Also, the setup quality is scored an 8, showing that the stock is consolidating in a helpful pattern with lower volatility, which can sometimes come before a new upward move. A clear support area is found between $122.36 and $125.49, giving a sensible level for risk management.
For a detailed look at the technical analysis, you can check the full technical report for PFSI.
Conclusion
PennyMac Financial Services offers a strong case for investors using a growth and momentum strategy. It successfully meets the strict technical filters of the Minervini Trend Template, confirming it is in a clear uptrend with good relative strength. At the same time, its very high earnings growth and firm revenue expansion meet the requirements for high-growth momentum investing. This combination of technical and fundamental force is exactly what methods like Minervini's SEPA (Specific Entry Point Analysis) approach aim to find.
For investors trying to find similar possible opportunities, this analysis was created from a preset screen. You can look at other stocks that currently fit these combined requirements by visiting the High Growth Momentum + Trend Template screen on ChartMill.
Disclaimer: This is not investment advice. The content is meant to be used for informational and educational purposes only. It is very important to do your own research and think about your personal financial situation before making any investment decisions. Please read our full disclaimer and terms of use to understand our responsibilities.