
For investors looking to join solid fundamental growth with well-timed technical entry signals, a multi-layered screening method can be especially effective. One approach is to find securities that show solid high-growth momentum traits while also displaying a positive technical breakout formation. This tactic tries to catch companies that are not just showing quickening earnings and sales but are also trading in a way that hints at a possible short-term price rise. A screen looking for a ChartMill High Growth Momentum (HGM) Rating over 4, a Technical Rating over 7, and a Setup Rating over 7 is made to find these chances. The aim is to locate stocks where fundamental momentum and technical condition meet, possibly giving a planned entry point.
NEWMONT CORP (NYSE:NEM) appears as a candidate from a screen like this. As the top gold mining company globally, its results are naturally linked to commodity prices, but a closer inspection of its recent numbers shows a time of notable fundamental momentum that matches what growth-focused investors look for.
Fundamental Growth Momentum
The High Growth Momentum Rating of 6 for Newmont shows a marked rise in its financial results, especially when viewed year-over-year. The rating brings together several important growth and momentum measures, which are vital for spotting companies in a stage of quickening profitability.
- Strong Earnings Growth: The most notable numbers are in earnings per share (EPS). Newmont's TTM EPS growth is at a notable 124.4%. This jump is not a single occurrence but part of a solid trend, with recent quarterly year-over-year EPS growth numbers of 111.1%, 98.6%, 127.3%, and 180.0% over the last four quarters.
- Steady Revenue Growth: Top-line growth has also been solid, with TTM revenue rising by 26.6%. Quarterly sales growth has been steadily positive, coming in at 20.0%, 20.8%, 24.5%, and 42.8% over the same time.
- Profit Margin Growth and Estimate Changes: The company has shown it can turn higher revenue into even bigger profits, a sign of operational efficiency that momentum investors appreciate. Also, analysts have raised their average EPS estimate for the next year by more than 14% in the last three months, showing increasing belief in the company's short-term outlook.
- Solid Execution: Newmont has surpassed both EPS and revenue estimates in each of the last four quarters, with an average EPS surprise of 26.3%. This regular ability to beat expectations supports the positive momentum story.
For the high-growth momentum method, these elements, quickening earnings and sales, growing margins, positive surprises, and rising revisions, are exactly what the combined HGM rating tries to identify. They point to a company that is not just growing but is in a stage where its operational results are beating earlier standards and market forecasts.
Technical Condition and Setup Quality
While the fundamental story gives the "why," the technical view gives clues about the "when." According to the detailed ChartMill Technical Analysis report, Newmont's chart shows noticeable condition and a positive pattern.
Technical Condition: A High Rating Newmont gets a full Technical Rating of 10, putting it in the market's strongest trending stocks. This score comes from several factors confirming a strong uptrend:
- Both the long-term and short-term trends are scored as positive.
- The stock is trading above all its main moving averages (20, 50, 100, and 200-day), and each average is itself in a rising pattern.
- Its relative strength is notable, with a yearly performance that beats 95% of all stocks in the ChartMill universe.
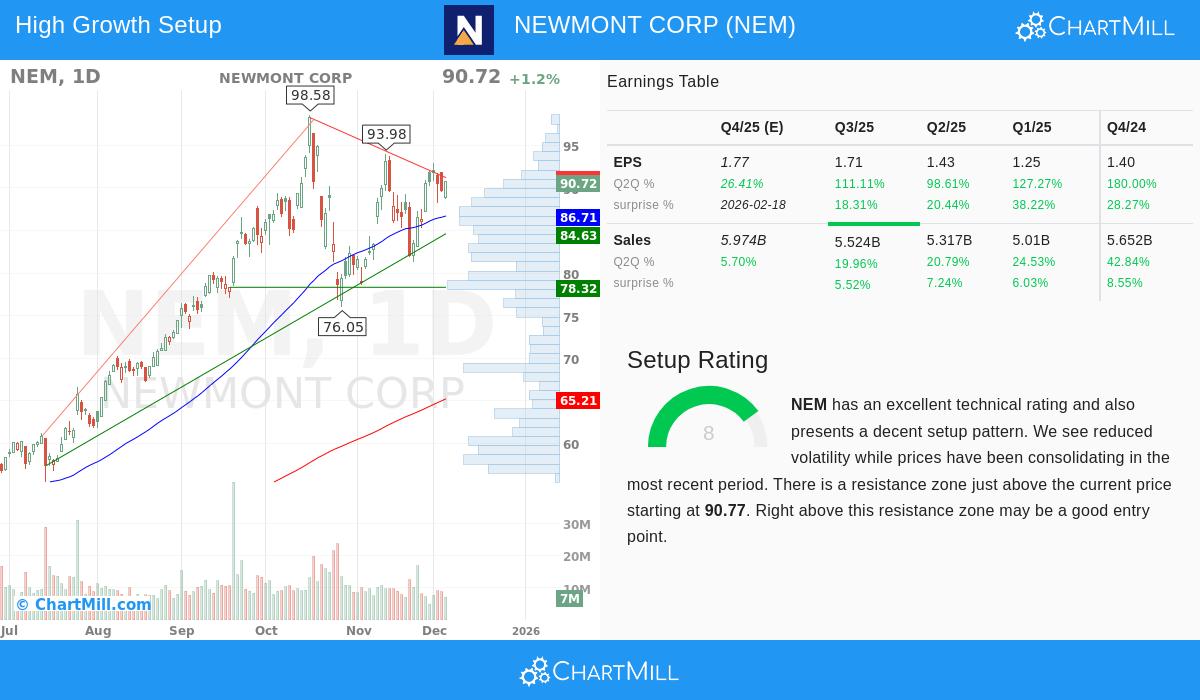
A Clear Setup for Possible Entry Maybe more important for timing, Newmont has a Setup Rating of 8. This high score signals the stock is settling within a set range after its earlier rise, which can sometimes come before a new move higher. The technical report states "reduced volatility while prices have been consolidating in the most recent period." The analysis finds a defined resistance area just above the current price, near $90.77 to $91.21. A clear move above this area could be seen as a breakout from the consolidation, possibly giving a defined entry point with a close support level for managing risk.
Meeting of Momentum and Pattern
The argument for Newmont within this specific plan rests on the combination of these two reviews. The company is showing fundamental traits sought by momentum investors, strong earnings growth, margin growth, and positive estimate changes. At the same time, its stock price action mirrors this condition through a high-level technical rating and is currently holding in a consolidation formation that shows a possible breakout setup. This pairing indicates that the fundamental momentum may be ready to show itself further in the stock price.
Investors using this mixed method can find other possible chances by running the screen themselves. You can see current results from this High Growth Momentum Breakout Setups screen here.
Disclaimer: This article is for information only and is not investment advice, a suggestion, or an offer to buy or sell any security. The review is based on given data and should not be the only ground for an investment choice. Investors should do their own research and think about their financial position, risk comfort, and investment goals before any trade. Past results do not show future outcomes.