
Investors looking for long-term growth chances at fair prices often consider proven methods that mix profit with careful risk control. One such method comes from famous fund manager Peter Lynch, whose system focuses on finding companies with lasting earnings growth, sound financial condition, and good value. This method stresses basic analysis instead of market prediction, looking for businesses that show steady results without too much guesswork. Companies that fit these requirements usually display measured growth speeds, controlled debt amounts, and effective use of capital, traits that may result in good long-term investments.
Basic Strength and Profit
NEWMONT CORP (NYSE:NEM) shows several traits that match Lynch's investment thinking. The company's profit numbers are notably strong, with a Return on Equity of 21.63%, much higher than Lynch's lowest limit of 15%. This points to good use of owner money and solid management. The mining firm also presents notable margin results across different measures:
- Profit Margin: 33.42%, doing better than 95% of similar companies
- Operating Margin: 43.31%, higher than 93% of others in the field
- Gross Margin: 60.71%, above 92% of industry members
These profit measures are key in the Lynch model because they show a company's skill in creating lasting earnings without depending too much on borrowed money or uncertain practices.
Growth Traits
Lynch stressed companies with maintainable growth speeds, usually between 15-30% each year, to prevent both slow businesses and unsteady high-growth cases. Newmont shows a five-year EPS growth speed of 21.58%, fitting well within Lynch's chosen span. This steady growth path implies the company is growing at a sensible speed without the ups and downs common with extreme growth stocks. Recent results show even stronger movement, with EPS growing 124.42% over the last year and income rising by 26.59%.
Value Measures
The value argument for Newmont seems strong when looked at through Lynch's favored measures. The company's PEG ratio of 0.70 sits much lower than Lynch's limit of 1.0, suggesting the stock may be priced low compared to its growth outlook. More value support comes from:
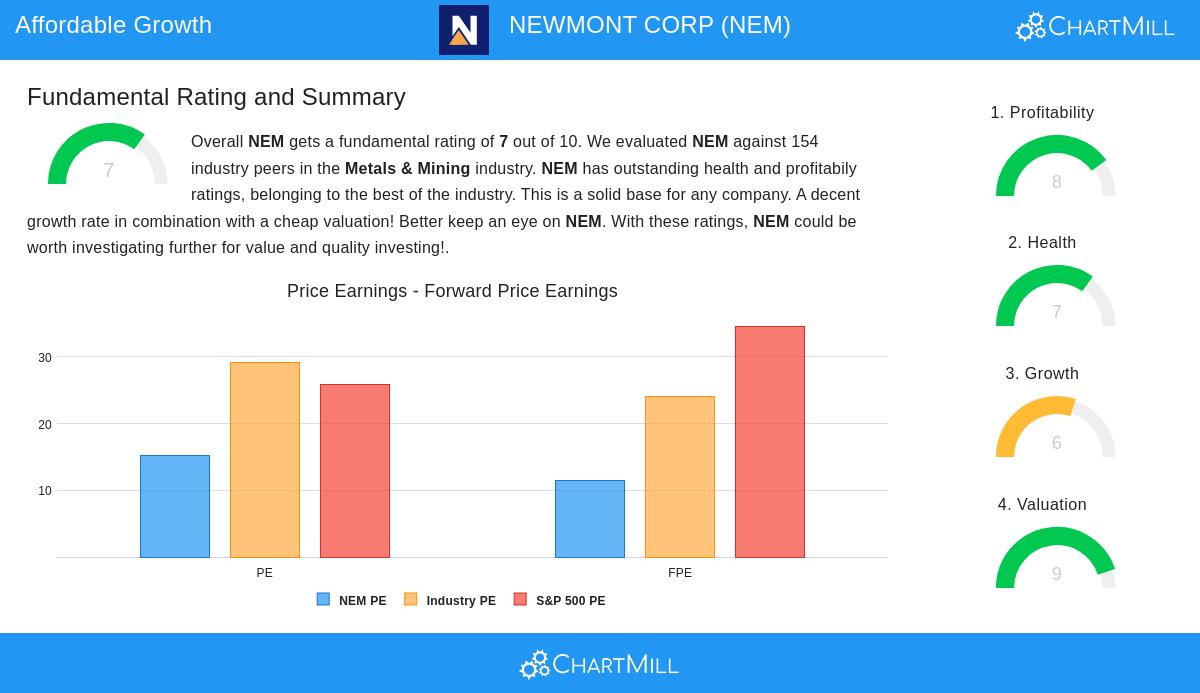
- P/E Ratio: 15.16, lower cost than 88% of similar companies
- Forward P/E: 11.47, showing a lower price than both industry and S&P 500 averages
- Enterprise Value/EBITDA: More appealing than 82% of others in the field
These value measures fit with Lynch's focus on finding fairly priced growth companies, as they hint that investors are not paying too much for future earnings possibility.
Financial Condition and Steadiness
Lynch put great stress on financial steadiness, choosing companies with little debt and good cash positions. Newmont does very well in these areas with a Debt-to-Equity ratio of 0.17, far below Lynch's preferred highest point of 0.25. The company's Current Ratio of 2.04 shows good short-term cash, passing Lynch's lowest need of 1.0. More condition signs include:
- Altman-Z Score: 3.84, pointing to low failure risk
- Debt-to-Free Cash Flow: 0.90, suggesting fast debt payback ability
- Positive working cash flow kept going over the past five years
Full Basic Review
According to ChartMill's full basic review, Newmont gets a total score of 7 out of 10, with especially high marks in profit (8/10) and condition (7/10). The company places well within the metals and mining field, showing both working quality and financial steadiness. While dividend growth has faced some recent softness, the payout ratio stays workable at 15.53% of earnings. The review states that future income growth guesses have slowed, though EPS growth forecasts remain sound at 11.66% each year.
Investment Points
For investors using the Lynch method, Newmont offers an interesting case of a well-set company in a standard field that still shows many qualities Lynch liked. The company's place in the gold mining area gives contact with goods that often act differently from wider markets, possibly giving mix benefits. Still, investors should think about the changing nature of goods prices and the high-cost needs of mining work when judging long-term possibilities.
The company's mix of fair value, sound financial condition, and maintainable growth traits makes it worthy of more study for GARP-focused portfolios. As with any investment, complete checking beyond screening rules stays very important.
For investors wanting to look at other companies that fit Peter Lynch's investment rules, more screening results can be found through our Peter Lynch Strategy Screener.
Disclaimer: This article presents factual information and analysis for educational purposes only and does not constitute investment advice, recommendation, or endorsement of any security. Investors should conduct their own research and consult with financial advisors before making investment decisions. Past performance does not guarantee future results.