
In this article we will dive into HOWMET AEROSPACE INC (NYSE:HWM) as a possible candidate for growth investing. Investors should always do their own research, but we noticed HOWMET AEROSPACE INC showing up in our Minervini growth screen, which makes it worth to investigate a bit more.
Minervini Trend Template Analysis.
The Minervini Trend Template is a set of technical criteria designed to identify stocks in strong uptrends. We can check all the boxes for HWM:
- ✔ Relative Strength is above 70.
- ✔ Current price is within 25% of it's 52-week high.
- ✔ Current price is at least 30% above it's 52-week low.
- ✔ The current price is above the 50-, 150- and 200-day SMA price line.
- ✔ The SMA(200) is trending upwards.
- ✔ The SMA(150) is above the SMA(200)
- ✔ The SMA(50) is above the SMA(150) and the SMA(200)
Why NYSE:HWM may be interesting for high growth investors.
Explosive Earnings Growth
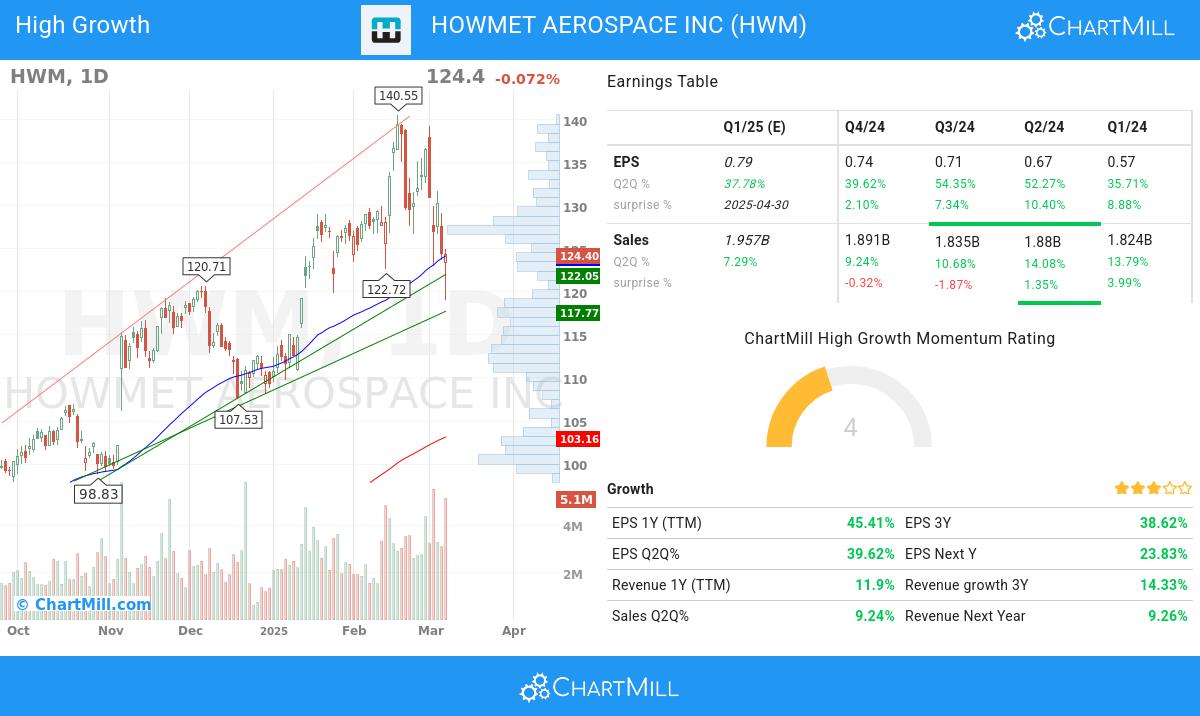
- The quarterly earnings of HWM have shown a 39.62% increase compared to the previous quarter, as revealed in the recent financial report. This growth signifies positive momentum in the company's financials, pointing towards a promising upward trend
- Over the past year, HWM has demonstrated 45.41% growth in EPS, signifying its positive financial trajectory and potential for future profitability.
- HWM has experienced 38.62% growth in EPS over a 3-year period, demonstrating its ability to generate sustained and positive earnings momentum.
- The earnings per share (EPS) growth of HWM are accelerating: the current Q2Q growth of 39.62% is above the previous year Q2Q growth of 39.47%. Earnings momentum and acceleration are key for high growth systems.
- The average next Quarter EPS Estimate for HWM has experienced a 10.22% change in the last 3 months, reflecting evolving expectations by analysts regarding the company's EPS performance.
- With a track record of beating EPS estimates in the last 4 quarters, HWM showcases its consistent ability to deliver earnings surprises. This reflects the company's strong execution and its competitive position in the market.
Profitability & Financial Strength
- HWM has shown positive growth in its operating margin over the past year, indicating improved operational efficiency. This growth highlights the company's ability to effectively manage costs and maximize profitability.
- HWM has experienced notable growth in its free cash flow (FCF) over the past year, signaling improved cash generation and strong financial performance. This growth suggests the company's ability to generate excess cash for reinvestment or shareholder returns.
- The Return on Equity(ROE) of HWM is 25.32%, which is a strong number. This indicates the company's ability to generate favorable returns for shareholders and reflects its effective management of resources.
- HWM exhibits a favorable Debt-to-Equity ratio at 0.73. This highlights the company's ability to limit excessive debt levels and maintain a strong equity base, demonstrating its financial stability and risk management practices.
Institutional Confidence & Market Strength
- The ownership composition of HWM reflects a balanced investor ecosystem, with institutional shareholders owning 92.82%. This indicates a broader market participation and potential for increased trading liquidity.
- HWM has maintained a healthy Relative Strength (RS) over the analyzed period, with a current 95.48 rating. This demonstrates the stock's ability to outperform its peers and indicates its competitive positioning. HOWMET AEROSPACE INC is well-positioned for potential price growth opportunities.
How do we evaluate the setup for NYSE:HWM?
In addition to the Technical Rating, ChartMill provides a Setup Rating for each stock. This rating, ranging from 0 to 10, assesses the extent of consolidation in the stock based on multiple short-term technical indicators. Currently, NYSE:HWM has a 8 as its setup rating:
HWM has an excellent technical rating and also presents a decent setup pattern. Prices have been consolidating lately. A pullback is taking place, which may present a nice opportunity for an entry. There is very little resistance above the current price. There is a support zone below the current price at 124.39, a Stop Loss order could be placed below this zone.
Check the latest full technical report of HWM for a complete technical analysis.
Final Thoughts
More ideas for high growth momentum stocks can be found on ChartMill in our High Growth Momentum + Trend Template screen.
Disclaimer
This is not investing advice! The article highlights some of the observations at the time of writing, but you should always make your own analysis and invest based on your own insights.