
For investors who use charts and price action to guide their choices, the search for promising opportunities often comes down to two main questions: which stock is in a solid trend, and when is the correct time to purchase it? A methodical way to answer these questions involves looking for stocks that show both good technical condition and a high-grade consolidation pattern, indicating a possible breakout. This technique merges a stock's existing momentum with a strategic entry point, with the goal of joining the next phase of a confirmed uptrend.
Our recent search for such technical breakout formations has found Hilton Worldwide Holdings Inc. (NYSE:HLT) as a candidate deserving further examination. The global hospitality leader, with its collection of more than 24 brands like Waldorf Astoria and Conrad, is currently showing a chart formation that matches the standards looked for by technical traders.
Reviewing the Technical Base
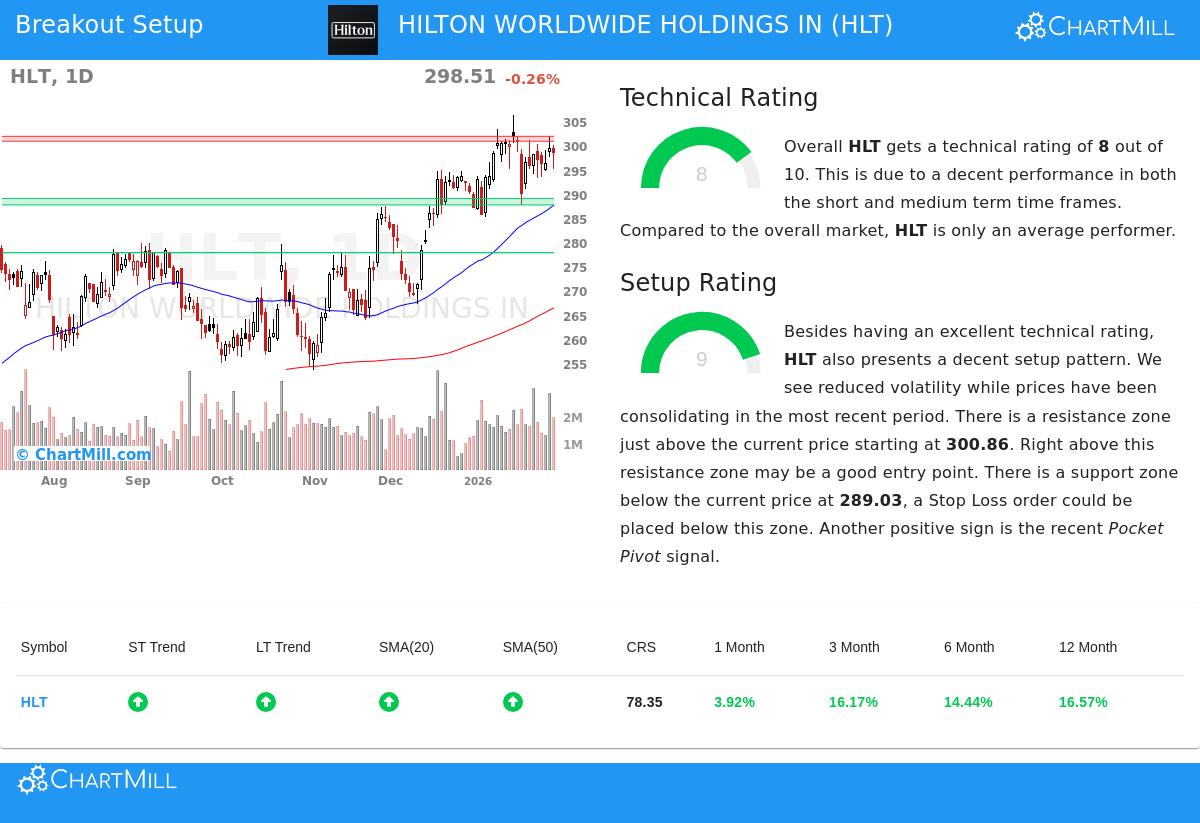
The first part of this plan is finding stocks with good basic technicals, pointing to a continuing uptrend. ChartMill's own Technical Rating, which grades stocks from 0 to 10, is made for this use. A grade of 7 or more is usually seen as a mark of a sound uptrend. Hilton's present grade of 8 points to a firm technical base.
An inspection of the full technical report shows the reasons for this grade:
- Trend Agreement: Both the near-term and longer-term trends for HLT are graded as positive, a pairing that shows steady buying interest across various time frames.
- Moving Average Backing: The stock is priced above all its main moving averages (20, 50, 100, and 200-day), and each of these averages is itself in an upward arrangement. This layered agreement of support levels is a standard trait of a solid bullish trend.
- Relative Performance: Inside its industry, Hilton is a notable performer, doing better than 86% of similar companies in the Hotels, Restaurants & Leisure group. Also, the stock is trading close to its 52-week high, showing strength even while the wider market stays near its own highs.
This mix of elements answers the "which stock" question for a technical investor. It shows that HLT is not a temporary riser but is rather in a verified, high-caliber uptrend, making it a fitting candidate for more formation study.
Judging the Formation Grade
A solid trend by itself is not a purchase signal; buying a stock that has just completed a big, stretched move can result in quick declines. The second vital question—"when to buy"—is answered by judging the grade of the stock's present consolidation or base formation. ChartMill's Setup Rating, also on a 0-10 scale, measures this. A high score implies the stock is trading in a narrow band, gathering force for its next price move, and gives clear points for entry and risk control.
Hilton receives a very good Setup Rating of 9. The technical report explains why this formation is developing:
- Consolidation in a Band: Over the last month, HLT has been trading between about $285 and $306. It is now located in the center of this band, showing a time of balance between buyers and sellers after its recent gain.
- Specific Risk and Reward Points: The consolidation has formed clear technical points. A resistance area is noted just above the present price, from $300.86 to $301.87. A clear move above this area could mark the beginning of the next bullish stage. On the other hand, strong support exists near $289, grouped around key moving averages and trendlines, giving a reasonable place for a protective stop-loss order.
- Supportive Indicators: The report also mentions a recent "Pocket Pivot" indicator, a volume-based formation that often points to accumulation by bigger investors during a consolidation, adding more weight to the formation's grade.
This high Setup Rating is important because it changes a strong stock into a possible trade. It finds a particular price area (above $301.88) where a breakout is probable to be confirmed, paired with a close level (below $287.68) to specify and contain risk, forming a good risk/reward situation.
A Possible Technical Formation
From this study, a specific, though only example-based, trading formation appears. A technical trader might think about an entry point just above the noted resistance at $301.88, using a buy-stop order to confirm the breakout has force. A stop-loss order could then be set just below the main support area at $287.68. This framework sets the trade's risk at about 4.7% from entry to stop, allowing for exact position sizing. It is a standard example of how the mix of a high Technical Rating and a high Setup Rating can turn into a workable plan.
Locating Additional Opportunities
Hilton Worldwide shows one present instance of a stock matching this breakout approach. For investors wanting to find other possible formations that meet similar strict technical and setup standards, new candidates are found each day. You can review the current list by going to the Technical Breakout Formations screen.
Disclaimer: This article is for information and learning only. It is not investment advice, a suggestion, or an offer to purchase or sell any security. The trading formation described is an automatic, example-based model using technical indicators and is not a promise of future results. Always do your own study, think about your financial position and risk comfort, and talk with a qualified financial advisor before making any investment choices. Past results do not predict future outcomes.

