Yesterday, CVCO was a tight volatility contraction pressing against a very obvious ceiling. If you haven’t read the first article yet, you can do so here.
Today, after the close, it’s no longer “setting up”.
It’s breaking out.
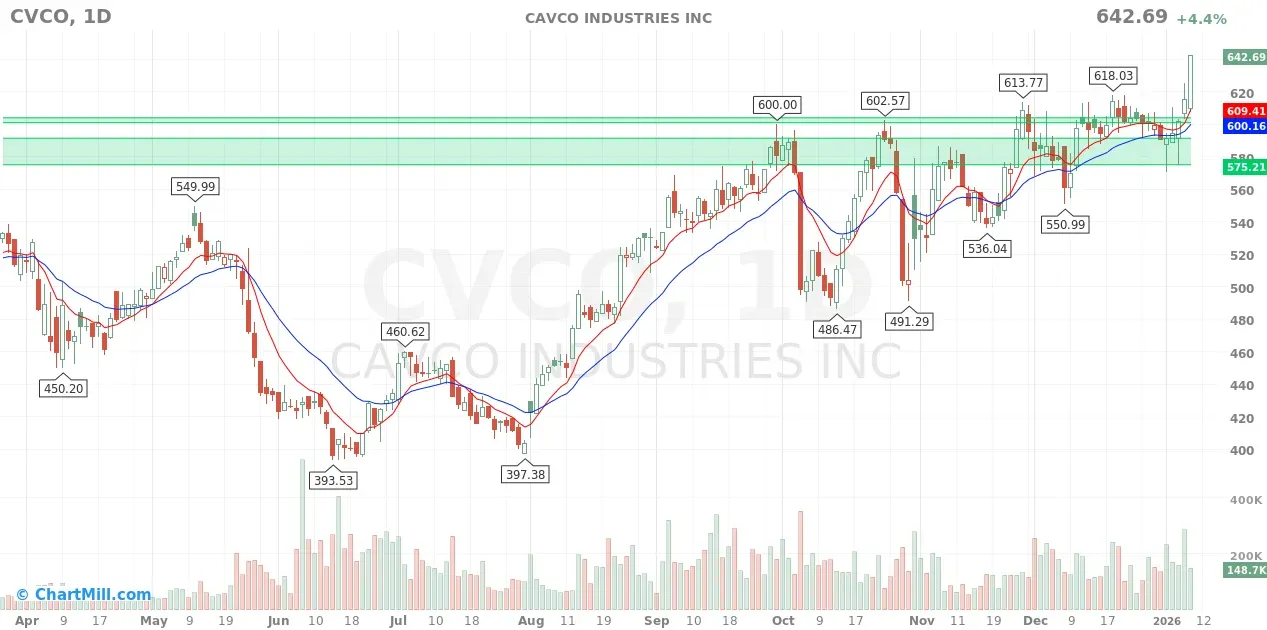
CVCO finished at 642.69 (+4.4%), a decisive close above the prior pivot zone around ~618–620. That’s exactly the kind of confirmation you want to see after a VCP: not a timid poke above resistance, but a clean, forceful push that changes the chart’s state from “compression” to “expansion”.
The market just voted. Loudly.
Now comes the part most traders mess up: trade management.
What changed technically
The key level did its job.
-
~618–620 was the ceiling.
-
Price didn’t just tag it, it cleared it and closed well above it.
That zone should now act as support on the next pullback.
- This is the basic VCP logic: old resistance becomes the new floor. If it doesn’t… we have a problem.
Read this like a systems engineer, not a fortune teller
A breakout day is not a finish line. It’s a state transition:
-
Before: supply being absorbed in contractions
-
After: demand stepping in and pushing price into “empty air”
That “empty air” is great… until it isn’t.
The only question that matters now is:
"Can CVCO hold above the pivot zone without collapsing back into the prior range?"
If yes, this becomes a proper swing trade candidate with room to trend. If no, it becomes one of those “great chart… until it wasn’t” cases.
A practical game plan from here
1) If you were already in (best-case scenario)
You’re sitting on a winner that behaved correctly. Your job is simple:
"Don’t turn a winning position into a random gamble."
Here are two rational stop frameworks (choose one based on your style):
Option A — Give it room (trend-friendly)
-
Stop goes below the breakout structure, typically somewhere under ~600 (or under the tighter shelf near ~595 if you want a bit more breathing room).
-
This reduces the chance of getting shaken out by normal volatility.
-
Trade-off: larger stop distance → smaller position size.
Option B — Tighten quickly (more active, less tolerance)
-
Use the low of the breakout day as the line in the sand (or slightly below).
-
If the breakout day gets meaningfully retraced fast, that’s a common early warning.
Both approaches are valid. What’s not valid is moving your stop based on mood swings.
2) If you’re not in (this is where people donate money)
A big breakout close creates the illusion of urgency. That’s the trap.
If you missed the initial entry, the higher-probability paths are usually:
Plan 1 — Pullback to the pivot
-
Watch for a controlled retracement toward ~618–620.
-
Best-case behavior: small candles, quiet pullback, buyers showing up quickly.
-
Entry is only interesting if the pivot acts like support (the “floor test”).
Plan 2 — Sideways digestion near highs
-
Price may simply go sideways for a few sessions and build a tight mini-base/flag.
-
That’s often healthier than a straight-line move.
What I don’t do: chasing extended strength after the breakout day.
The levels I care about now
This is the updated map. No poetry, just levels.
-
~618–620: the pivot zone - must hold on a retest.
-
~600: deeper support - if price loses this, the breakout is getting damaged.
-
~595 → ~575: last meaningful support band - back in here and the breakout thesis is in serious trouble.
If CVCO falls back under the pivot and starts living there again, I don’t negotiate with the chart.
Managing the win: how not to sabotage it
A lot of traders are excellent at finding breakouts… and terrible at handling them.
My rules are boring on purpose:
-
Never widen a stop.
-
If the stock proves you wrong, exit quickly.
-
If the stock proves you right, avoid “profit panic”, manage with structure, not emotion.
-
Consider scaling out only if it helps you hold the remainder objectively.
If you need excitement, get a hobby. Trading is a risk business, not a dopamine business.
What would invalidate this breakout
I’m watching for any of these “wrong behavior” signals:
-
A sharp reversal that closes back below the pivot zone quickly
-
A retest of ~618–620 that fails decisively
-
Heavy selling that drags price into the prior range (breakouts shouldn’t do that if they’re real)
A clean breakout should either:
-
hold above the pivot, or
-
retest it briefly and bounce.
It should not behave like a trap door.
Bottom line
This breakout is a technical “yes”.
But after the breakout, the edge shifts from pattern recognition to risk execution.
If CVCO holds above the pivot zone, the trade can work beautifully. If it fails, it should be a small loss (or a protected win), not a story you tell yourself for weeks.
The chart has done its part.
Now we do ours.
Remember, this is NOT financial advice. Just a structured view of price, levels, and risk.
Kristoff - ChartMill