![]()
Some stocks announce their intention with clean structure. Cavco Industries (CVCO) is doing exactly that: a classic Volatility Contraction Pattern (Minervini-style) tightening up just beneath resistance.
Yesterday’s breakout attempt that popped and then slipped back a bit doesn’t bother me. In fact, I expect a little slap-back near a major level. Real breakouts often need to shake out the last impatient buyers before they can run. The question isn’t “Did it clear it on the first try?” The question is: Does it stay tight and refuse to break down?
I like setups that behave like well-designed systems:
-
fewer moving parts (tight price action),
-
clear failure points (defined support),
-
and predictable behavior under stress (breakout attempts + controlled pullbacks).
CVCO currently ticks those boxes.
The technical thesis (what matters, and what doesn’t)
I’m a technical swing trader first. Fundamentals are… supporting actors. I don’t need a novel, I need a trend + tightness + a risk box.
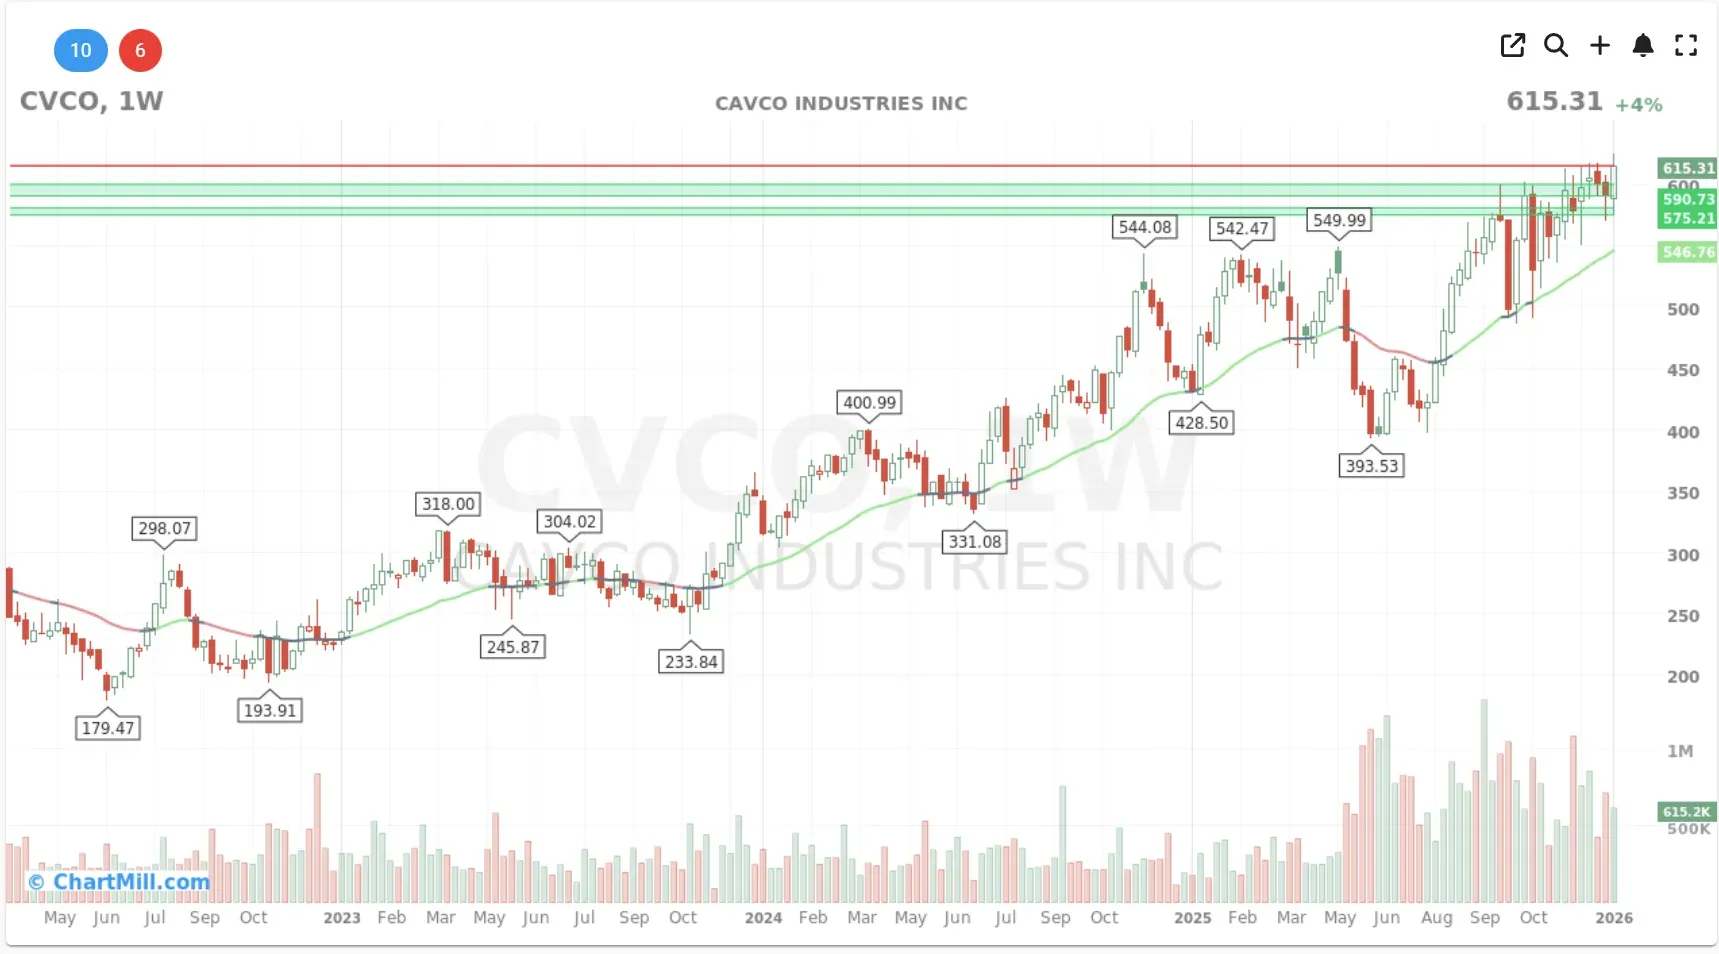
The big picture: uptrend intact (weekly)
On the weekly chart, CVCO is in a multi-year uptrend and has worked its way back to new highs after a nasty mid-2025 drawdown. The key point: it recovered, reclaimed levels, and is now building above prior resistance, exactly what strong stocks do.
The rising longer-term moving average (the green weekly line) is acting like structural support. That’s the kind of “floor” I want beneath a breakout attempt.
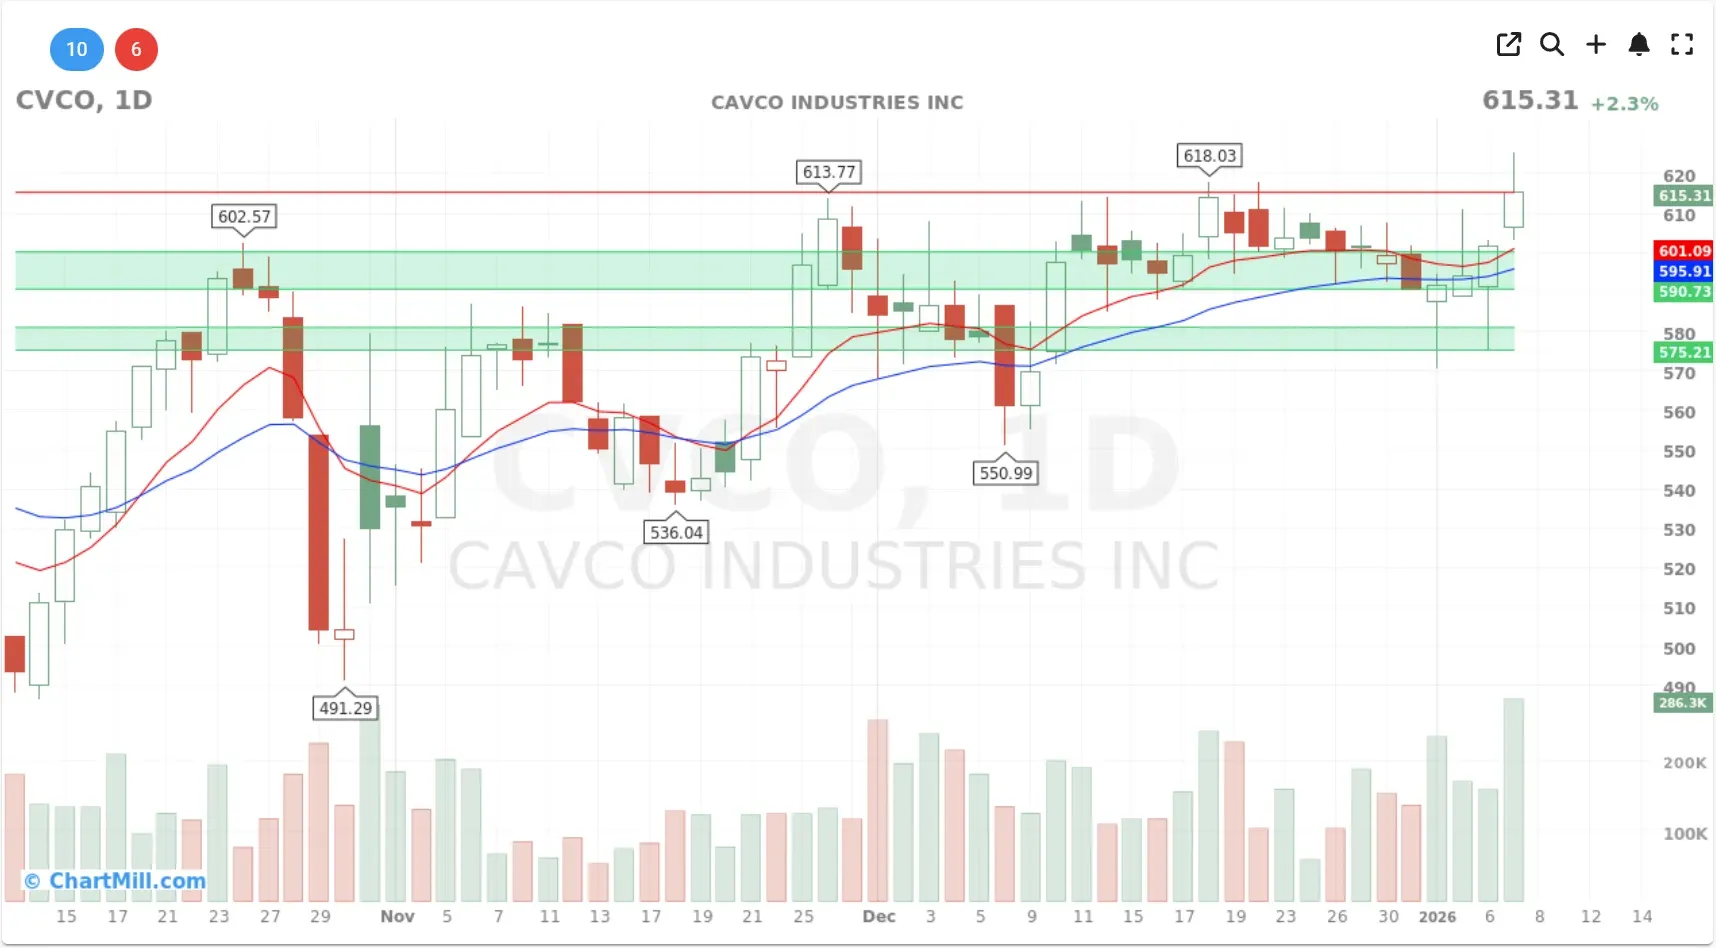
The setup: VCP mechanics (daily)
On the daily chart, you can see the contractions getting smaller as price tightens under the highs:
-
Earlier pullbacks were deeper (emotion, uncertainty, supply).
-
The recent pullbacks are shallower (less supply, more absorption).
-
Price is now compressing near the top of the range.
That’s the VCP in one sentence: volatility contracts while the stock holds near highs.
And yes: the breakout attempt that didn’t immediately sprint higher is normal. What I want now is tightness and support holding.
Levels that matter (my “if/then” map)
Let’s keep this unemotional and geometric.
Resistance / pivot area
~618–620: this is the obvious pivot zone near the recent highs.
A clean push through that area, ideally with strong volume and a convincing close, is the “go” signal for the more conservative entry.
Support zones (where my thesis lives or dies)
~600–602: first nearby support (recent battle line).
~590–595: next support shelf (if this breaks, the breakout is suspect).
~575: last meaningful support area before the chart starts looking “wrong.”
If CVCO loses the 590–595 zone with authority, I’m not interested in “hoping.” Hope is not a risk management technique.
The trade plan (two ways to play it)
Plan A — Breakout entry (clean, boring, repeatable)
Entry trigger
- Buy on a decisive move above ~620, preferably with volume expansion and no instant fade.
Stop
-
Tight stop: below ~600 (higher chance of stop-out, smaller per-share risk)
-
Loose stop: below ~595/590 (lower chance of stop-out, larger per-share risk)
-
Defensive stop: below ~575 (with the intention of a longer term position)
Why I like this
-
Clear pivot.
-
Clear failure point.
-
No overthinking. (My favorite kind of thinking.)
Plan B — “Tight pullback” entry (cheaper, but you must be strict)
If price pulls back and holds ~600–602 tightly (small candles, quiet volume), that can be a lower-risk entry if you’re willing to sell fast when wrong.
Entry trigger
- Tight action around ~600–605 with support clearly defending.
Stop
- Below ~590–595 depending on how tight the pullback is.
This one rewards precision, but it punishes hesitation. If support breaks, you’re out. No debate. No committee meeting.
Position sizing (risk management is the whole game)
I size every trade the same way:
- Shares = (Account Risk $) / (Entry − Stop)
Example (round numbers):
-
Account: $50,000
-
Entry: $620.20
-
Stop: $594.82
-
Risk per share: $620.20 − $594.82 = $25.38
If you risk 1% per trade:
-
Account risk $: 1% × $50,000 = $500
-
Position size: $500 / $25.38 = 19.70 shares
So in practice:
-
19 shares (stays under the $500 cap)
-
Dollar risk ≈ 19 × $25.38 = $482.22
-
20 shares (slightly over 1%)
-
Dollar risk ≈ 20 × $25.38 = $507.60 (≈ 1.02% of account)
That’s it. The math doesn’t care about my feelings, which is why I like it.

If this “define the pivot, map the supports, pre-calculate the risk, then execute without drama” approach resonates with you, that’s basically the backbone of our Swing Trading Course at ChartMill.
It’s built for novice (and not-so-novice) traders who want a structured, repeatable method: how to find A+ setups, where to enter, where you’re wrong, how to size positions, and how to cut losses fast without letting emotions hijack the plan.
The course is included for free with a yearly ChartMill subscription, and if you prefer something standalone, you can also buy the course separately as a PDF.
Details here: Mastering Swing Trading
Upside expectations (targets without fortune-telling)
I don’t marry targets. I date them casually and trail stops.
But to have a framework:
-
If the “coil” spans roughly 575 to 618–620, that’s about 40–45 points of range.
-
A basic measured move puts a first objective in the mid-660s.
In practice, I’d rather manage this with:
-
a trailing stop under short-term moving averages,
-
or selling partial into strength and letting the rest ride.
The goal is not to predict the top. The goal is to not be there when it breaks.
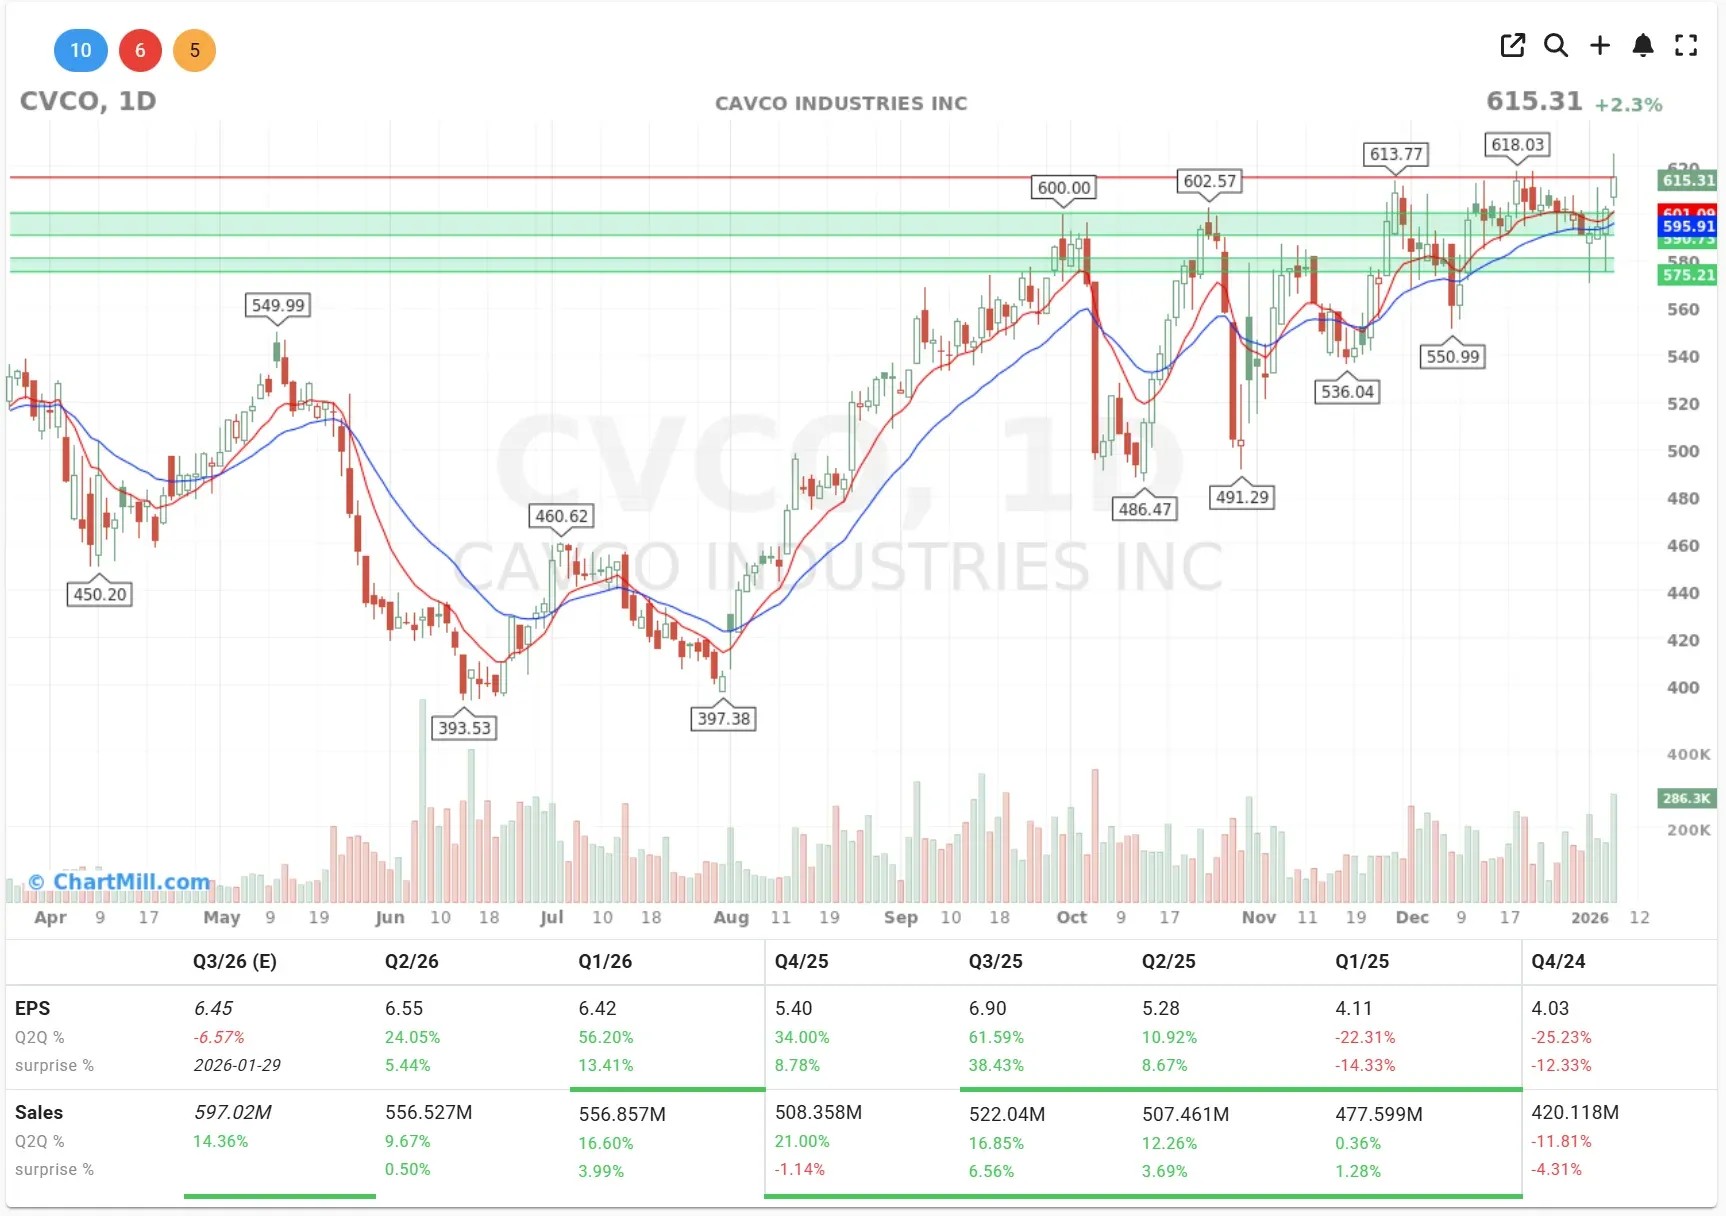
Fundamentals (secondary, but supportive)
Under the daily chart, the quarterly EPS and sales figures are improving and generally accelerating (especially the more recent quarters versus earlier weakness). That’s the kind of fundamental tailwind I want behind a technical breakout: not because I’m valuing the company, but because strong trends often feed on improving business momentum.
Still: if the chart fails, I don’t care how pretty the spreadsheet is.
What would make me exit fast (or avoid the trade entirely)
My invalidation rules are blunt on purpose:
-
A breakout above ~620 that fails hard and closes back below the pivot with heavy volume.
-
A breakdown below ~590–595 (support shelf lost).
-
Trend deterioration: moving averages flattening/rolling + repeated distribution.
If I’m wrong, I want to be wrong quickly and cheaply.
Bottom line
CVCO is acting like a leader: tight, strong, coiled near highs, with improving underlying numbers as a bonus. The pivot is clear, the support zones are clean, and the risk can be defined before you click buy.
That’s my favorite kind of trade: one where the market tells me exactly when I’m wrong.
Not financial advice. I’m just a person who thinks in price, levels, and failure points and who sleeps better with a stop in the system.