
CIENA CORP (NYSE:CIEN) has been identified by our stock screener as a high-growth momentum stock that also aligns with Mark Minervini’s Trend Template. The company, a leader in network technology, demonstrates strong technical trends and improving fundamentals, making it a candidate worth examining for growth-oriented investors.
Technical Strength: Meeting Minervini’s Trend Template
CIEN satisfies key criteria from Minervini’s Trend Template, which focuses on identifying stocks in strong uptrends:
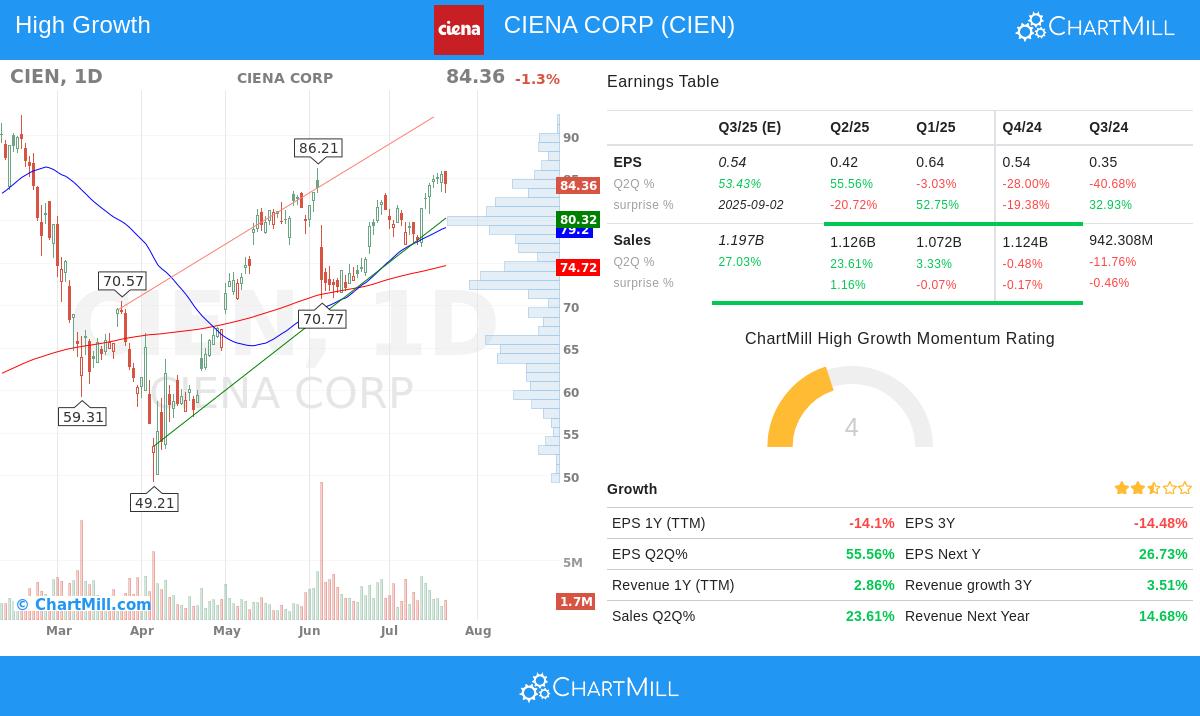
- Price Above Key Moving Averages: The stock trades above its 50-day ($79.20), 150-day ($76.96), and 200-day ($74.72) moving averages, confirming a bullish trend.
- Upward-Sloping Moving Averages: Both the 150-day and 200-day MAs are rising, indicating sustained upward momentum.
- Relative Strength: With a ChartMill Relative Strength score of 91.65, CIEN outperforms 91% of all stocks, a key trait of market leaders.
- Price Near 52-Week High: At $84.36, CIEN is within 17% of its 52-week high ($101.44), a sign of strong momentum.
Growth Fundamentals: High Growth Momentum (HGM) Rating
Beyond technicals, CIEN shows promising growth characteristics:
- Recent Earnings Acceleration: Quarterly EPS grew 55.6% year-over-year, a sharp improvement from previous quarters.
- Revenue Growth: Sales increased 23.6% in the latest quarter, reversing earlier declines.
- Profit Margin Expansion: The latest quarter’s profit margin (7.97%) shows recovery from prior weakness.
- Free Cash Flow Growth: FCF per share surged 181% year-over-year, indicating strong cash generation.
While some metrics, like annual EPS growth, remain negative, the recent quarterly improvements suggest a potential turnaround.
Technical Outlook & Setup
According to ChartMill’s technical report, CIEN holds a perfect technical rating of 10, supported by:
- Strong short- and long-term uptrends.
- Trading near the upper end of its recent range ($76.06 - $85.88).
- High liquidity with average daily volume of 2.24M shares.
The setup rating is 6, indicating moderate consolidation. A breakout above $85.48 could signal a new upward move, while support lies near $78.26.
For a deeper technical breakdown, review the full technical analysis report.
Our High Growth Momentum + Trend Template screener lists more stocks meeting these criteria.
Disclaimer
This is not investment advice. Always conduct your own research and consider risk management before making investment decisions.