
For technical investors looking to spot stocks ready for their next rise, a common method centers on two main parts: the basic force of the trend and the state of the present price formation. The aim is to locate stocks that are not just in clear uptrends but are also holding gains in a narrow band, indicating a possible breakout may be near. This method sorts out stocks that are merely stretched and overbought, instead focusing on those that are gathering force for a lasting advance. A daily filter joining ChartMill's own Technical Rating and Setup Quality Rating is made for this task, searching the market for securities showing both sound technical condition and a superior setup formation.
One stock that recently appeared from this filter is BARCLAYS PLC-SPONS ADR (NYSE:BCS). The British banking firm's American depositary receipts are now showing a notable technical view, receiving high scores in both trend force and pattern development. This pairing indicates BCS may be getting ready for a notable price shift, making it a stock of note for traders using breakout methods.
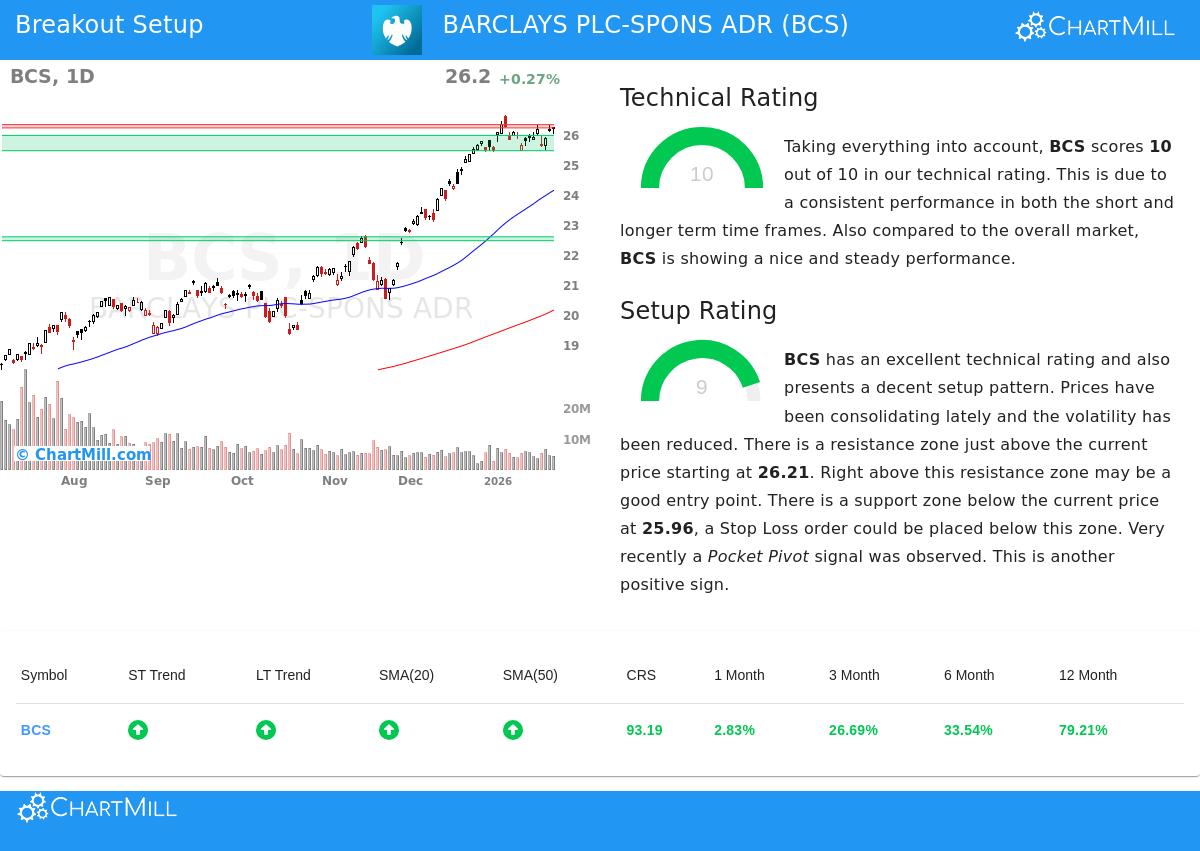
Technical Force: A Base of Momentum
The first part of the breakout method is finding a stock with clear technical force. This makes sure any possible advance happens inside the frame of a current uptrend, raising the chance of a good outcome. Barclays is strong here, having a perfect ChartMill Technical Rating of 10 out of 10. This high score comes from a detailed study of the stock's price movement across different periods.
A close look at the full technical report shows the reasons for this top rating:
- Strong Trend Agreement: Both the near-term and long-term trends for BCS are marked as positive. This agreement across periods is a solid bullish sign, showing continued buying interest.
- Better Relative Performance: The stock's yearly gain places it above 93% of all stocks in the ChartMill set. More notably, inside the competitive Banks field, it beats 97% of its 383 competitors, showing clear field strength.
- Price Above Important Averages: BCS is trading well above all its main simple moving averages (20, 50, 100, and 200-day), and each of these averages is itself in a rising state. This layered agreement of support levels is a standard sign of a good uptrend.
- Nearness to Highs: The stock is trading close to its 52-week high of $26.64, confirming the force of its upward path.
This outstanding technical setting is key for the method because it answers the "which stock?" question. A high Technical Rating confirms BCS is a market leader in a solid uptrend, the perfect choice for a continued advance.
Setup State: The Formation for a Possible Breakout
While a solid trend is needed, it is not enough for a good entry point. A stock can be technically sound but overstretched, leaving a trader open to a quick decline. This is where the second part, setup state, becomes important. It answers the "when to buy?" question by finding times of pause or rest inside the larger trend.
Barclays now shows a superior setup, getting a Setup Rating of 9. The study shows prices have been holding in a narrow band over the past month, between about $25.40 and $26.64, with a clear drop in price swings. This tightening action often comes before a clear move.
Main parts of the setup include:
- A Clear Resistance Area: Just above the present price, a resistance area is found between $26.21 and $26.32. A clear move above this area could mark the start of the next bullish stage.
- Close Support for Risk Control: Below the present price, a major support area exists around $25.96 (reaching down to $25.45). This gives a sensible place to set a protective stop-loss order, setting the trade's risk from the start.
- A Bull Flag Formation: The technical report notes BCS is now showing a bull flag formation. This is a continuation formation where prices ease back slightly in a narrow channel after a fast rise, usually ending with a breakout upward.
- Recent Gathering Signal: Very recently, a "Pocket Pivot" signal was seen, which is a price/volume formation suggesting gathering by bigger buyers—a positive confirming signal for the setup.
The high Setup Rating confirms that BCS is not just trending; it is pausing in a steady way, offering a clear point for entry (above resistance) and a close point for exit if the breakout does not work (below support).
A Specific Trading Plan
Based on this study, the technical report suggests a possible trading setup. The idea follows the breakout method exactly: enter on force above the found resistance and control risk below close support.
- Suggested Entry: A buy stop order at $26.33, placed just above the resistance area to confirm bullish momentum.
- Suggested Stop-Loss: A sell stop order at $25.43, placed just below the recent holding low and key support zone.
- Set Risk: This plan creates a worst-case risk of about $0.90 per share, or 3.42% of the entry price.
It is important to note that this is an example made from the technical measures. Traders must always change such ideas to match their own risk comfort, position size plans, and confirm the setup with their own study.
Locating Like Chances
The case of Barclays PLC shows the kind of chance the Technical Breakout filter is made to find. For investors wanting to search for like setups in other strongly trending stocks, new choices are found daily. You can see the present list of technical breakout setups by going to the Technical Breakout Setups screen.
Disclaimer: This article is for information and learning only. It does not form a suggestion to buy, sell, or keep any security, including BCS. The trading plan shown is an automatic example based on technical signs and is not personal investment advice. All investing and trading includes risk, including the possible loss of principal. Always do your own full research, think about your money situation and risk comfort, and talk with a qualified financial advisor before making any investment choices. Past results do not show future outcomes.