
Technical investors looking for breakout chances often use methodical screening processes to find stocks with both good basic momentum and positive entry levels. One method uses ChartMill's own Technical Rating, which assesses a stock's total technical condition, with its Setup Quality Rating, which examines consolidation patterns that might come before notable price changes. Stocks with high marks on both measures often show interesting technical formations where solid trends meet possible breakout points.
Technical Strength Evaluation
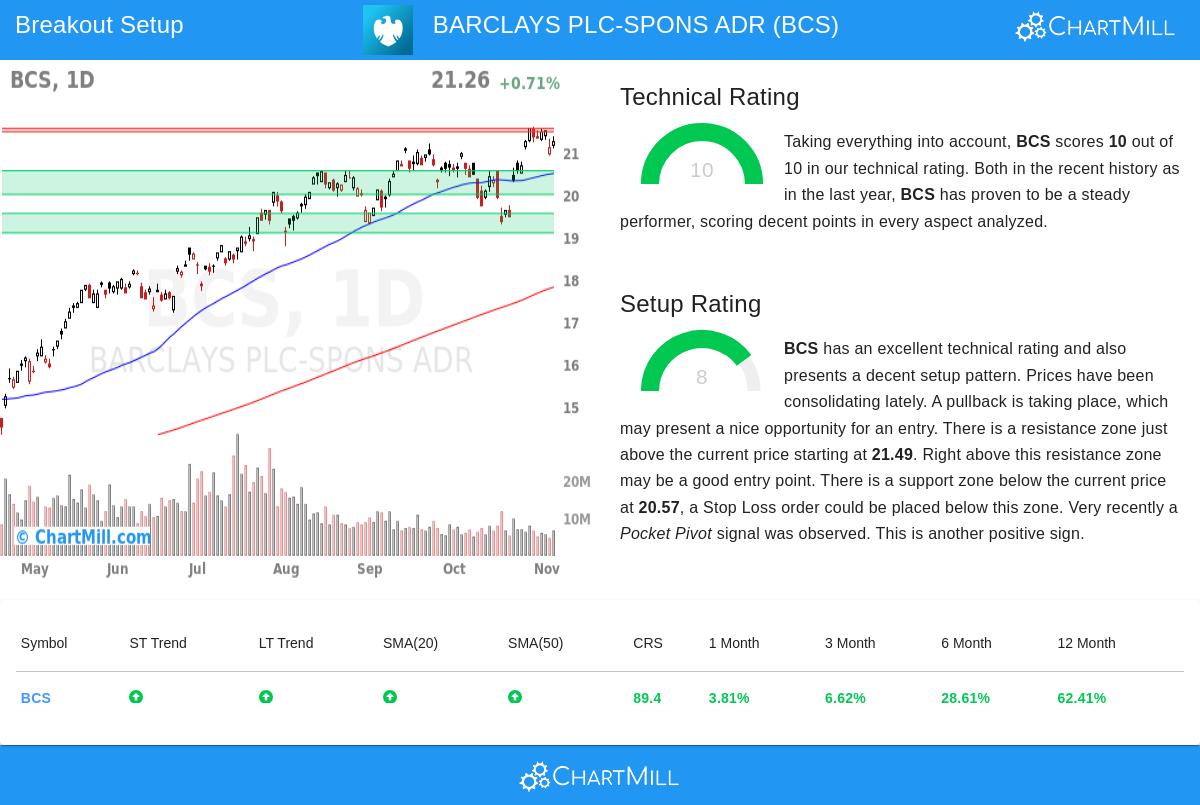
BARCLAYS PLC-SPONS ADR (NYSE:BCS) shows very good technical features based on the ChartMill Technical Analysis report, getting a top rating of 10 out of 10. This highest mark shows wide-ranging strength in several technical areas that are important for finding stocks with continuing upward momentum.
Important technical positives are:
- Both short-period and long-period trends are clearly positive, showing agreement across various time frames
- The stock has done better than 89% of all stocks in the last year with steadily spread gains
- In the banking industry, Barclays is in the top 4%, doing better than 96% of 390 sector companies
- Present trading close to 52-week highs matches wider market strength in the S&P 500
- All main moving averages (20, 50, 100, and 200-day) are increasing and located under the present price
This technical solidity gives the basic momentum that breakout traders look for, as stocks with high technical ratings have shown a better chance of continued upward movement after consolidation breakouts.
Setup Quality Evaluation
Besides its technical condition, Barclays shows an interesting setup formation with a Setup Quality Rating of 8 out of 10. This high mark means the stock is in a constructive consolidation inside its existing uptrend, making circumstances good for a possible breakout entry.
The setup evaluation shows a number of good features:
- Prices are consolidating in what looks like a bull flag formation, usually happening after solid advances
- A recent pocket pivot signal points to institutional buying, where price increased on volume greater than the highest down volume of the last ten days
- Clear support is found between $20.01 and $20.57, made by several trendlines and moving averages
- Resistance is seen between $21.49 and $21.57, giving a specific breakout level
The mix of technical condition and good setup creates circumstances where a breakout above resistance might signal the next upward phase in the existing uptrend. The specific support area allows for accurate risk control with stop-loss positioning.
Trading Points
For technical traders watching this setup, the evaluation indicates a possible entry above $21.58, which would be a breakout above the identified resistance area. The close support group near $20.50 gives a sensible area for stop-loss positioning, restricting possible loss to about 5% on the trade. The 2.52 ATR space between entry and stop levels is within acceptable limits for breakout methods.
The present bull flag formation development, together with the pocket pivot signal, supports the quality of this setup. These formations often come before notable moves when they happen in stocks with good basic technicals, making this mix especially notable for technical investors.
Locating Other Chances
Technical breakout setups like Barclays can be found daily through methodical screening. Investors wanting to find comparable chances can review the Technical Breakout Setups screen which filters for stocks with both high technical ratings and good setup formations.
Disclaimer: This evaluation is based on technical indicators and pattern identification for information only. It is not investment advice, financial guidance, or a suggestion to buy or sell any security. Investors should do their own research, think about their risk comfort, and talk with financial advisors before making investment choices. Technical analysis has limits and past results do not assure future outcomes.