
Investors often face the challenge of balancing the promise of future earnings with the reality of current market momentum. One strategy that seeks to address this is combining strong fundamental growth characteristics with favorable technical patterns. The goal is to identify companies that are not only growing their business at an impressive rate but are also near a possible price move upward, as shown by their stock charts. This two-part method aims to match a company's basic financial strength with good market feeling, possibly finding chances where basic value and chart-based timing meet.
BARRICK MINING CORP (NYSE:B), a major global producer of gold and copper, recently appeared from a screen made to find such chances. The screen looks for stocks showing strong growth, good profitability and financial soundness, together with a chart formation hinting at a possible upward move. Barrick's profile presents a strong case for why it fits these particular requirements.
Fundamental Growth and Strength
At its center, a growth stock must show an ability to increase earnings and revenue much faster than similar companies. According to ChartMill's fundamental analysis report, Barrick gets a good Growth Rating of 7 out of 10. The company's recent results provide the base for this score:
- Earnings Per Share (EPS) increased by 72.22% over the past year, with a solid average yearly growth rate of 19.55% over several years.
- Revenue also showed strong yearly growth of 18.39%.
- Looking forward, analysts think this pace will keep going, with EPS predicted to grow by an average of 20.99% each year.
Beyond growth, the screen needs "good profitability and health," which are important for lasting success. A company can grow fast but struggle if it is not profitable or carries too much debt. Barrick scores well here, with a Profitability Rating of 8 and a Health Rating of 7.
- Profitability Points: The company has notable margins, including an Operating Margin of 44.74% and a Return on Equity of 14.25%, putting it in the high group of its industry.
- Financial Health: Barrick keeps a sound balance sheet with a low Debt/Equity ratio of 0.18 and good liquidity, shown by a Current Ratio of 2.94. This financial steadiness gives protection against commodity price swings and helps continued spending in its projects.
Technical Move Upward Possibility
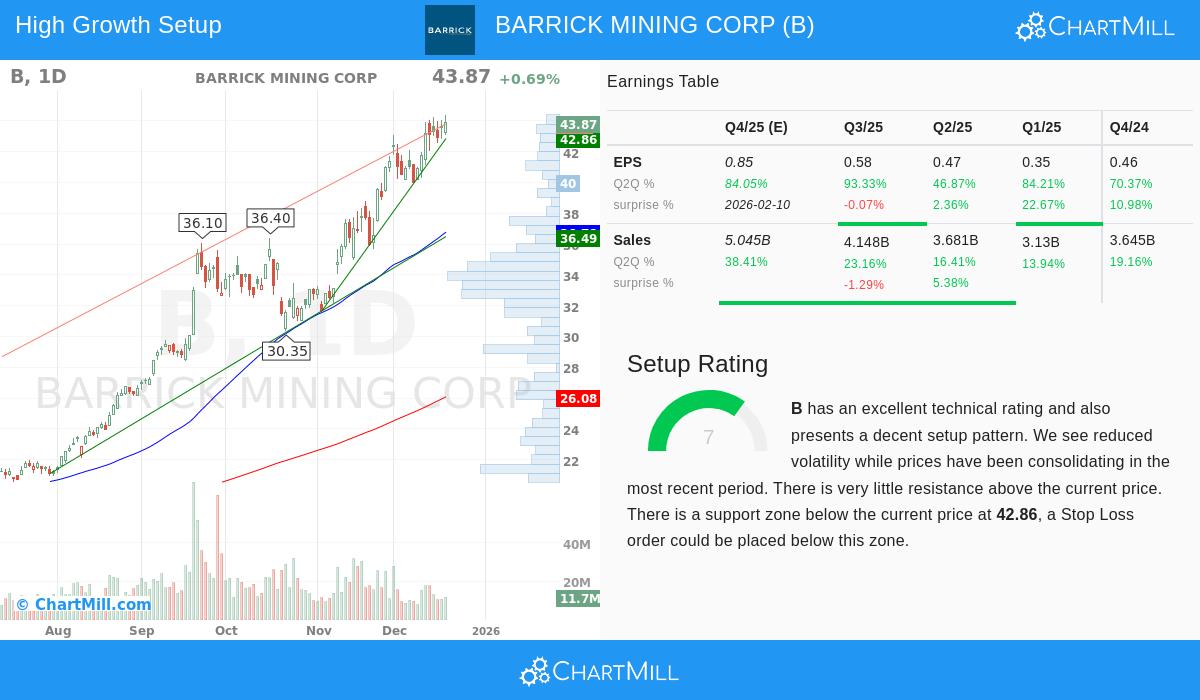
Strong fundamentals are a needed base, but the chart analysis part tries to find the right time for market notice. ChartMill's technical analysis report gives Barrick a top rating of 10, with a specific Setup Rating of 7, pointing to a good pattern for a possible upward move.
The chart view is clearly positive:
- Both the long-term and short-term price directions are firmly good, with the stock trading well above its important moving averages (50-day, 100-day, and 200-day).
- The stock is currently testing a 52-week high, a common sign of strength that often comes before an upward move if the level is clearly passed.
- The report mentions "less price movement while prices have been holding in a range in the most recent period," which can come before a big price shift. With "very little price barrier above the current price," an upward move could see the stock start trading in a new, higher range.
Valuation Setting
For a growth stock, price is always a thought. Barrick's Valuation Rating of 7 suggests it is fairly priced compared to its future. While its standard Price-to-Earnings (P/E) ratio is similar to the wider market, more future-looking measures seem good. Its Price/Forward Earnings ratio is clearly lower than the S&P 500 average, and its Enterprise Value/EBITDA ratio is lower than over 82% of its industry group. When growth is included via the PEG ratio, the price looks more interesting, showing the market may not be completely valuing the company's expected earnings growth.
Conclusion
Barrick Mining Corp presents a case where fundamental and chart analyses agree. The company is producing and is expected to keep producing strong earnings growth, backed by very good profitability and a strong balance sheet, important needs for a lasting growth investment. At the same time, its stock chart shows a strong upward direction and is holding steady near 52-week highs, a chart formation that often draws trend-following buyers and can lead to a big upward move. This mix of speeding business results and good price action is exactly what the combined screening method tries to find.
This review of Barrick came from a particular screening method. Investors wanting to find other stocks that fit similar needs of strong growth, sound fundamentals, and good chart formations can look at the predefined screen on ChartMill.
Disclaimer: This article is for information only and does not make up financial advice, a suggestion, or an offer to buy or sell any security. Investing has risk, including the possible loss of the original amount invested. Always do your own research and think about your personal money situation and risk comfort before making any investment choices.