
The method used to find possible investment candidates joins a strict technical structure with an attention to fundamental growth momentum. This process is guided by the ideas of well-known trader Mark Minervini, whose Trend Template is made to find stocks showing strong, continued upward movements. By selecting securities that fit these particular technical conditions, such as the arrangement of important moving averages and nearness to new highs, the screen makes certain candidates are already in a verified phase of market strength. This technical base is then combined with a High Growth Momentum (HGM) rating, which measures a company's earnings speed, revenue increase, and profit margin growth. The aim is to locate companies where solid price movement is backed by essential business momentum, forming a combination of technical and fundamental force that has come before notable price gains.
Technical Force: Matching the Minervini Trend Template
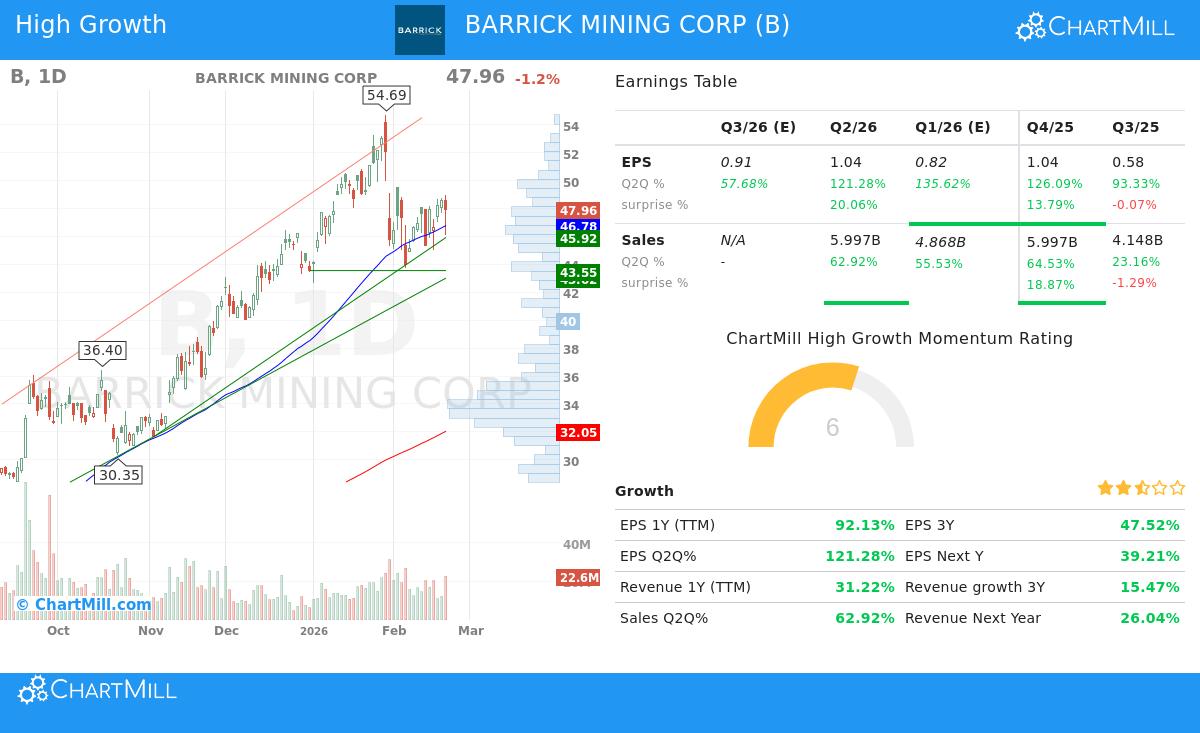
A central idea of the Minervini method is to put money in the direction of the existing trend, steering clear of the errors of trying to buy during a decline. The Trend Template gives a step-by-step list to verify a stock is in a solid, extended upward movement. BARRICK MINING CORP (NYSE:B) now shows a match with a number of these important technical measures:
- Price Higher Than Important Moving Averages: The stock's latest price of $47.96 trades well above its 50-day ($46.78), 150-day ($36.04), and 200-day ($32.05) simple moving averages (SMAs). This layered arrangement points to continued buying interest across several periods.
- Positive Moving Average Directions: The 200-day SMA is not only pointing up but has also grown from a past value of $31.90 to its present $32.05, verifying a positive long-term direction. The 50-day SMA is also positioned above both the 150-day and 200-day SMAs, a standard positive setup.
- Nearness to Highs: With a 52-week high of $54.69, the present price is within 25% of this top, a Minervini condition that concentrates on force instead of low price. At the same time, the price is over 30% above its 52-week low of $17.00, showing a forceful recovery direction.
- Better Relative Performance: The stock has a ChartMill Relative Strength (CRS) score of 96.34, meaning it has done better than about 96% of the market during the last year. High relative performance is a sign of market leaders and is emphasized in the Trend Template to make sure money moves into the strongest performers.
Fundamental Momentum: The Driver for High Growth
While the Trend Template finds how a stock is moving, the High Growth Momentum rating aims to know why. For a direction to last, it should preferably be driven by speeding up business essentials. Barrick Mining Corp makes a strong argument on this point, with several measures pointing to solid operational and financial momentum.
Earnings and Sales Speed: The company is showing major year-over-year growth. The latest quarter saw Earnings Per Share (EPS) rise by 121.3% compared to the same quarter last year. This is not a single event, as the two earlier quarters also reported notable growth of 126.1% and 93.3%, in order. This sequence of high, repeated growth rates is a main part of the HGM rating and implies forceful basic earnings momentum.
Profit Margin Growth: Possibly more important than total revenue increase is the growth of profitability. The company's profit margin in the last reported quarter hit 40.1%, a large rise from 31.4% the quarter before, 22.0% two quarters earlier, and 15.1% three quarters ago. This steady, step-by-step gain in margins shows not just higher sales, but more effective and profitable operations—a key element for lasting high growth.
Analyst Belief and Future Projections: The fundamental account is also backed by analyst changes. Over the last three months, the average projection for next year's EPS has been changed upward by 18.2%, while revenue projections have been increased by 8.8%. These upward changes often show growing belief in the company's future potential and can be an early sign of continued institutional buying.
Combining the Setup
The mix of a technically healthy chart and solid fundamental momentum forms a strong investment argument. The Minervini method stresses that the largest stock market winners nearly always display strong earnings and sales growth prior to their most dramatic price moves. In Barrick's situation, the forceful fundamental gains in profitability and earnings are happening at the same time as a technically verified upward movement, suggesting the price force has a good basis.
From a technical analysis view, the given TA report gives Barrick a high score of 9 out of 10, noting a steady overall result and a positive long-term direction. The report states the stock has done better than 96% of the market over the past year and finds several support levels under the present price, which can help outline risk. You can see the complete, itemized technical analysis here: Barrick Mining Corp Technical Analysis Report.
Locating Comparable Chances
Barrick Mining Corp shows the kind of security that meets a joined filter of technical direction force and fundamental growth momentum. For investors wanting to use this method to find other possible candidates, the preset screen used to locate this setup is ready for more study. You can investigate more outcomes and change the measures to your own conditions through this link: High Growth Momentum + Trend Template Screen.
Disclaimer: This article is for information and learning only. It is not meant as investment guidance, a suggestion, or an offer to buy or sell any security. The analysis is based on given data and certain methods, but past results are not a guide for future outcomes. Investors should do their own study and think about their personal financial position and risk comfort before making any investment choices.